Abstract
Use of computers in education is now ubiquitous. Students have access to course media through a variety of devices including PCs, tablets, and smart phones. The data generated by online learning platforms have the potential to change the way we teach and learn. In this brief survey paper, we explore the role of analytics in teaching and learning. In particular, how learning analytics can lead to educational process innovation. We will explore history, current state, tools, privacy issues, case studies, and future potential for analytics-based education.
KEY WORDS: analytics, K-12, higher education, data driven, analytics driven
1. INTRODUCTION
In this inaugural edition of the International Journal on Innovations in Online Education, we explore the role of analytics in teaching and learning. In particular, how learning analytics can lead to educational process innovation. Analytics is the discovery and communication of meaningful patterns in data (Wikipedia, 2001). The main goal of using analytics is to go beyond descriptive statistics to provide the best prediction of what may happen in the future. The end result is to streamline decision making and produce new insights that lead to better actions. As more and more technology is integrated into today′s instruction from K-12 to higher education to continuing education, there is an unprecedented opportunity to use analytics to make learning more effective and efficient (Campbell and Oblinger, 2007). This paper explores some current efforts in analytics-driven education and its potential as a revolutionary force to change the way we teach and learn. We will discuss case studies on how analytics were used in multiple disciplines and will highlight some of their impact on teaching and learning. As more and more data are collected, there is the opportunity to analyze and extract meaning from this data. The advances in machine learning and data sciences will also contribute to analyzing millions of data records fast and deriving actionable intelligence. In the next few sections, we will explore history, current state, tools, privacy issues, case studies, and future potential for analytics-based education.
2. HISTORY
Predictive analytics has its origin in the 1940s, when governments first started using the computational models with early versions of modern computers. Today, we have the enormous capability to collect and process large amounts of data in seconds to provide more real-time analytics. For years, the use of analytics has enabled businesses to make smarter decisions and to run their organizations more effectively (Business Analytics, 2001). Predictive analytics is the process of deriving what might happen in the future based on historical patterns of data. It uses a variety of techniques such as data modeling, machine learning, and statistical techniques to make these predictions. Although most businesses have always used data to drive their business decisions, education has been lagging in these areas. Historically, resource constraints have been an obstacle for educational institutions and faculty who would have preferred to use this data in a meaningful way to extract actionable intelligence. Also, most early learning management systems and other educational platforms did not have the open data exchange methodologies that are more readily available today in most platforms.
Use of technology in education is not new. It started with the introduction of course management systems (CMS) such as Blackboard (Blackboard, 1998) and eCollege (eCollege, 1996) in the late 1990s and early 2000s. These platforms allowed instructors to organize their courses and provide access to calendars, discussion forums, content, and assessments. The grade books in these early systems gradually replaced the paper versions of grading systems. These platforms allowed grade books to be exported in Excel format to be analyzed further. More widely used educational platforms such as Blackboard (Blackboard, 1998) contained other statistics such as quiz access times and success rates in specific questions, among many other things. Since then, the Blackboard system has improved tremendously by providing more detailed data about student and course activities. In 2007, Purdue University launched Course Signals (Course Signals, 2009, Arnold, 2010) one of the earliest uses of comprehensive learning analytics. The project integrates data from multiple sources including student information systems, course management systems, and course grade books to generate a list of at-risk students targeted for intervention. In 2008 (Knewton, 2008), an adaptive learning technologies company that provides personalized learning to K-12, was formed. The company collects data about student learning and provides customized lesson plans to individual students. Edmodo (Edmodo, 2008) is another educational technology company formed in 2008, offering communication, collaboration, and coaching tools to K-12 schools and teachers. Edmodo is a popular platform among teachers who use it to organize their courses using a familiar social media metaphor. Classroom Salon (Classroom Salon, 2008) was formed in 2011 as a learning content management system (LCMS) as a result of years of research at Carnegie Mellon University (CMU). An LCMS integrates administrative functionalities such as creating and managing learning communities (“salons”), authoring content, scheduling activities, and closely tracking online learning activities and providing detailed analytics including summarized user and document activity reports, document access trends, and export capabilities for each interaction record. These LCMS systems allow greater flexibility in customizing courses, introducing new instructional designs, and modifying instructions based on system analytics. Course Smart (Course Smart, 2007), a digital textbook provider, formed an alliance with five textbook publishers to offer the analytics package called Course Smart Analytics that tracks the student engagement with course textbooks and provides reports to professors who can then assess student effort. There are many other initiatives aimed at using learning analytics in educational settings and many are listed in the Horizon Report by New Media Consortium (Johnson, et al, 2013).
Historically, teachers have always used grade books, course objectives, and individual student observations to make informed decisions. In smaller classes, it was easier to detect students who are at the risk of dropping out and then take measures to fix the problem. But this is difficult in higher education where class sizes have grown considerably larger especially in demanding areas such as computer science and engineering. In these large enrollment classes, other techniques were necessary to analyze large amounts of student data. Data mining in higher education is not new and many have used supervised and unsupervised learning algorithms to predict the potential for student success (Luan, 2004). The accountability, demands for information, and the role of information technology in colleges and universities have been discussed extensively in the literature (Hawkins, 2008). National agendas for action analytics have been developed (Norris et al., 2009), but the use of analytics by individual instructors to improve everyday teaching remains low. Now there is a greater opportunity to discuss, develop, and implement methods and tools that can provide us deep insights into teaching and learning. In recent years, tools and methods have been developed to help instructors use analytics in their teaching. Some platforms also provide student dashboards (Classroom Salon, 2008) that can inform the student when they are at the risk of failing or falling behind. Use of analytics in education is now gaining ground. Some educators are proposing to adopt a common language to discuss analytics in education (van Barneveld et al., 2012). Some have examined the conditions for engagement in online learning environments and the role of the instructor (Ma et al., 2015). There is enough evidence to show that the proper use of data leads to smarter teaching and better learning outcomes (Dawson et al., 2008). Learning analytics is the third wave in education that began with the advent of course management systems (Brown, 2011).
3. CURRENT STATE
Use of computers in education is now ubiquitous. Students have access to course media through a variety of devices including PCs, tablets, and smart phones. The data generated by these devices can be broadcast to an entire class or individual students as activity streams. An activity stream is a continuous list of time-stamped system activities (such as document uploads, student comments and discussions, notifications of important events) that informs students of the current state of the course. The use of social networks such as Facebook and Twitter has promoted the use of activity streams to inform latest news updates, status changes, and shared stories to its users. This concept of social media type activity streams can be expanded to education to include the notification of aggregated activities that can be highly beneficial to the student. The power of these activity streams lies in their ability to record change as it occurs. In the context of education, they have the potential to increase student motivation (Wankel and Blessinger, 2012) as personalized activity streams are continuously broadcasted to students.
The role of data in education is not simply to transfer pre-digital-era content (textbooks, surveys, and questionnaires) to the digital era, but also introducing more qualitatively rich data to make the analysis about the learner status more accurate. The new data are ubiquitous, persistent, and connected, making them different from the data we have been able to collect in the past. Unlike in the past, now it is easy to generate data by designing learning activities to measure student understanding of concepts. For example, highlighted passages and student comments can inform instructors on the collective or individual understanding of a particular concept.
We define data-driven education as the ability to use real-time data to drive instructions. For example, if the instructor knows where students are having trouble, then the lecture can be customized to serve the students better. The current popularity of flipped learning models provides an excellent opportunity to collect learning data before the instructions occur. Flipped learning requires students to engage with content before face-to-face meeting times. This engagement data can then be used to customize in-class instructions.
One difficulty in higher education is that the amount of data available to instructors to make decisions is fairly small. This is mainly due to limited knowledge that higher education instructors have about the prior knowledge of the students they are teaching. Making decisions from “small data” is a new area of study that has gotten attention in recent times (Lee et al., 2015). Often, instructors only know that a student has completed a prerequisite course or two, but do not have enough data to assess the depth of understanding of prior subject matter. Therefore, small data methods require more continuous data streams to make informed analytical decisions. Data is only a representation or symbol of what happens in the world. In most contexts, the goal of data collection and analysis is to provide insight and the basis for informed decisions. The process of setting up, collecting data, converting data to information, and using actionable intelligence to make informed decisions is a critical step in implementing a data-driven learning strategy. As shown below, the educational environment must be established to collect data, data need to be processed to obtain information, and information needs to be analyzed to generate actionable intelligence (Figure 1).
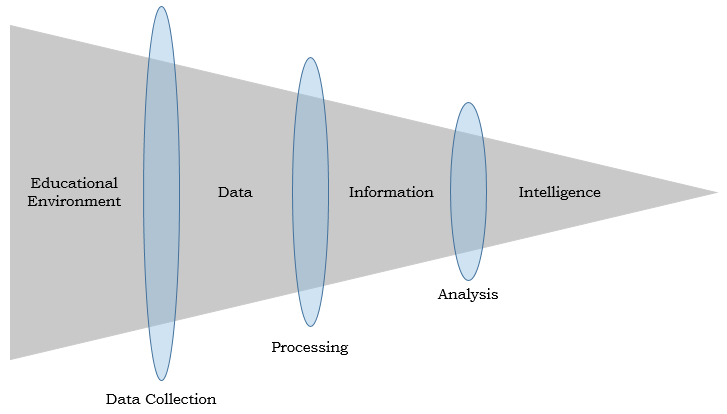
FIG. 1: From Data to Intelligence
The promise of learning analytics is the opportunity to reduce cost and obtain better learning outcomes by smartly combining human and technology resources. More and more funding agencies are recognizing the need to scale education using learning analytics. Google recently provided funding (Google, 2015) to CMU to study how to scale computer science education using learning analytics. CMU will use Classroom Salon (CS) as the learning analytics platform for the proposed study.
The use of analytics in improving business processes is not new (Business Analytics , 2001). Businesses have been using analytics to find better ways to serve their customers and increase sales for many years. More and more businesses are employing data scientists to go through vast collections of business data to extract market and customer intelligence. Of particular interest are the hidden patterns that can be discovered as a result of utilizing novel algorithms. These data provide valuable insight into what customers want and what they would pay for a product. Companies increasingly need to generate new sales and continue existing sales. Companies are now using this vast collection of data to do just that. The “business” of education is no different. Education must be efficiently delivered and outcomes must be validated. As more and more educational services move to cloud architectures (Cloud Computing, 2014), the opportunity to store, share, analyze, and act on data also increases at a global scale. More and more businesses are tracking their customer clicks to know how much time they spend on a site and how to improve a specific page or product offering. This is no different for education. If educators know what resources students are accessing, how they are reading documents or watching videos, where they find important or confusing information, it is possible to act on the data to provide better classroom instructions (Gunawardena and Kaplan, 2013). For those who are using YouTube videos as part of their instructional strategy, Google provides a host of data including total access times, average access times, and geographical data to give a sense of how important a particular video is. For example, if students are returning to a particular video many times, that can indicate importance or difficulty of the video content and instructors can devise strategies to address the student needs better. We also need to underline the potential negative effect of analytics in education, as collection of vast amounts of data can raise privacy concerns. The privacy issue is even more relevant in K-12 education where collecting any kind of student behavior data can be controversial. Another risk of having “too much” data is that of educators counting solely on analytics to make decisions. Therefore, it is important to find ways to balance the need to use analytics to improve education while minimizing the risk of that data being used for unintended tasks or misinterpretation. This is the challenge and opportunity that we have in front of us.
In developing this paper, we contacted a number of instructors who use educational analytics to change the way they teach and assess their students. These instructors used many different platforms to gather the data. The tools varied from legacy course management systems such as Blackboard and Moodle, to more recent learning management systems like Edmodo and Knewton. We also included “deep analytics” based platforms like CS, an analytics-driven social interpretation tool developed at Carnegie Mellon University. Deep analytics can be defined as the process of extracting intelligence from large and multisource data sets that may be structured, semistructured, or unstructured. Classroom Salon can aggregate large amounts of data from multiple sources, including student access of documents and videos, highlighted text and video data, and self-organized networking within the system to produce actionable analytics reports. The goal of CS is to increase students′ direct engagement with content and using these data to extract hidden information such as student sentiment and use of language to demonstrate understanding, excitement, or confusion (Kaufer, 1998). For completeness sake, we also mention intelligent tutoring systems based platforms like Open Learning Initiative (OLI) (Open Learning Initiative, 2001). OLI platforms have played an important role in managing student learning using a solid research base in learning sciences. OLI systems heavily use analytics to provide customized learning paths to individual students and have played an important role in education for over 20 years. OLI based courses however are not easily customizable and hence not easily adaptable. For the purpose of this paper, we only included a few platforms where individual instructors build, deploy, and assess student outcomes. However, we note that there are many other platforms with built in courses and analytics that can help drive the teaching and learning strategy. We hope to address those platforms in future issues. The actionable data generated in the quoted studies were quite significant in teaching and assessment of student learning and were used frequently to improve class instruction. For future editions of this journal, we invite educators and institutions to submit papers where use of analytics lead to better class instructions and learning outcomes.
4. TOOLS
Almost every academic course is now supported by one or more electronic platforms. The majority of the instructors we surveyed use course management systems such as Blackboard, Moodle, Canvas, and Sakai, among many others. Our surveys indicated that most instructors use these tools simply as content, quizzing, and grade book repositories. Instructors also use these tools more as a convenient way to distribute course material, gather student submissions, make announcements, answer student questions, conduct tests/quizzes, and record student grades. Platforms such as Blackboard (1998) are also integrated with a number of third party applications like turnitin.com, a plagiarism management tool, and Q&A tools like Piazza (2011). Almost all of the course management systems we considered had some analytics, although few instructors used these data to assess student engagement in order to improve teaching. Moodle, for example, provided data on how much time a student spent on the site, or how many students accessed a particular assignment, or how many assessments students completed. A basic grade book is part of all these sites and instructors can often see if a student has failed to submit an assignment or has not attended the class. Most educators do not pay much attention to internal data such as time on the site or if a particular student accessed an assignment. Instructors often do not have enough resources or knowledge to use data such as time on site to better their teaching. But most instructors used observations such as lack of engagement, timely completion of assignments, and low exam scores as indications for increased risk of course failure or dropout. The newer educational platforms such as Knewton (2008) and Edmodo (2008) provided more comprehensive analytics and better dashboards. Knewton for example, used data modeling to drive student learning paths. Edmodo provided more social features such as messaging and networking. Edmodo is also supported by a number of applications that can be integrated into instructions. The deep analytics platforms like CS (Classroom Salon, 2008) provided very specific data on how students view and interact with specific content (to the individual word or video frame). The contentcentric aspect of Classroom Salon (CS) provided an alternate way to design activities and collect more fine-grained analytics. In CS, interactive learning activities can be built into the context of media (highlighted text or video prompt) to engage students directly with content. The “hotspots” generated by student annotations can be interpreted and used for teaching and learning.
5. PRIVACY ISSUES
Perhaps the biggest barrier to data-driven education is privacy. It is a difficult balancing act on deciding what data to collect, what data to display, what data to analyze, and what data to act on. The Gates Foundation (2000) has long supported initiatives based on data-driven learning in K-12, but has been challenged many times due to privacy issues at local, regional, and national levels. Educational institutions often struggle with these questions on balancing privacy versus using data to support teaching and learning. If a higher education faculty member wants to collect data, analyze, publish, and present in a conference, they often require the permission of the institutional review board (IRB). IRBs often grant this permission to research projects that are low in risk. Fortunately, educational data analytics can be categorized as low-risk experimentation as long as individual privacy is maintained. Platforms such as CS and others allow students to comment and reply anonymously to other users, while disclosing student identities only to instructors. One other way to overcome the privacy issue is to assign special codes to students. The true identities of students are stored in a centralized secure database with access to a specific student only provided when it is in the best interest of the student as determined by a person of authority. As long as institutions and researchers can satisfactorily guarantee that data will remain private and only accessible by authorized people, the opportunity to collect data and use it for actionable and predictive analytics will remain strong. Privacy concerns alone should not be a barrier to analytics-driven education. Processes and policies must be developed at all levels to balance the need for privacy versus the enormous potential of data. Systems can also provide options for “opting-out” that can allow individuals to decide when to allow institutions to collect their educational data. We invite potential authors to submit papers on data privacy for future editions of this journal.
6. CASE STUDIES
In this section, we discuss some case studies involving tools such as Edmodo, Knewton, and CS. These case studies may represent only a handful of analytics-based activities happening throughout the United States and elsewhere. Based on the preliminary research we did, the use of analytics in education remains low among faculty. Most analytics-based educational initiatives are carefully designed local, regional, or national studies and have not scaled to institutions outside of the research community. We found little evidence that individual instructors use analytics for day-to-day decisions on what to teach and how to teach. However, we saw increasing evidence of the use of real-time analytics to better education in cases like Chemistry Education (Blecking, 2014). In the following section, we discuss some case studies involving Edmodo (2008), Knewton (2008), and CS (Classroom Salon, 2008).
6.1 Edmodo
Edmodo is a popular social learning network in K-12 space. According to website, the site has over 15 million users. The site is easy to use, encourages Facebook-like communication among students, and provides tools for teachers to monitor activities. The major analytics functionality is only available to administrators. The administrator can monitor how many teachers and students are logging into Edmodo on a daily basis. At a super administrator level, the analytics can show school activities, school accounts, and an overall district summary. It can also show schools in a stack-ranked mode with the most active school on top. Clicking on each of the schools can show a stack-ranked list of most active teachers, students, and groups. Clicking on either teacher or student names will show you a list of all their posts, as shown in Figure 2.
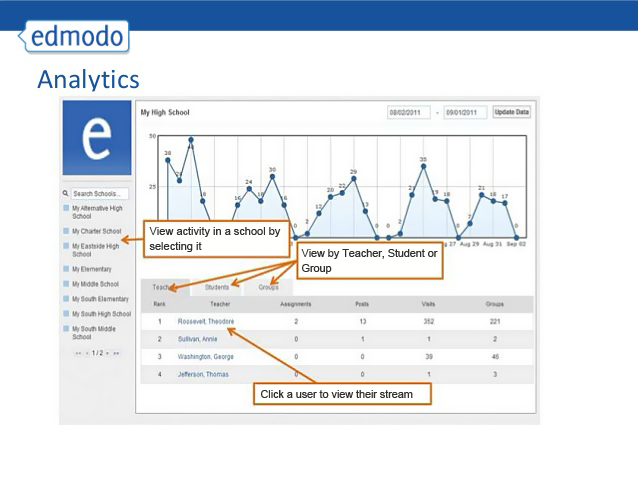
FIG. 2: Edmodo District Dashboard
We list two case studies that Edmodo provided to us based on our requests for information.
6.1.1 Edmodo Case Study 1: District Spotlight Chula Vista Elementary School District, California
This study involved Edmodo helping to improve learning and engagement for English language learners (ELLs). Although the Chula Vista Elementary School District (CVESD) has been steadily improving academic proficiency levels over the past 10 years, the academic achievement gap between ELLs and others was evident. CVESD sought new ways to deepen student engagement and expand learning beyond the walls of the classroom prompted by concerns that this gap could increase as California transitions to Common Core State Standards. CVESD wanted to find a solution that would be easy to use for teachers and students alike. CVESD noted that Edmodo was used successfully in another district′s Gifted and Talented Education (GATE) Program for those at risk of being left behind. The district selected a cohort of 20 teachers to enroll in “Edmodo in Action,” a six-week online professional development program designed to help teachers integrate Edmodo into their daily practice and meet their instructional goals. By focusing on the end and not the means, the program also equipped them to serve as mentor-teachers to their peers, helping to scale training across the district. The program served 29,000 students, 1500 teachers, and 47 schools. Administrators and teachers used data visualization on CVESD network activities and on the Edmodo teacher connection. This resulted in a well-supported, yet grassroots adoption of Edmodo district wide. Teachers, students, and parents quickly adopted the platform and within 12 months 100% of teachers and 75% of students in the district were registered users. Using Edmodo as their social learning platform, CVESD was able to focus on closing the learning gap with ELLs by providing personalized support using data analytics, as ELL students often require individual attention from a teacher to increase the chance of success. The ELL students who did not want to participate verbally in class for fear of their accent or mispronunciation were able to compose their thoughts in writing. Teachers placed students in small groups so they could learn comfortably alongside similar peers. Because Edmodo is available online and via mobile devices, it facilitates anytime, anywhere learning and access to classwork and as a result many data points were generated to support administrators to assure program success. The Edmodo analytics showed that students were active throughout the week, including Saturday and Sunday. Edmodo analytics and online tools also gave the ability for teachers to keep parents involved. In addition to adopting Edmodo in the classroom, CVESD is also using Edmodo to increase district-wide collaboration by creating virtual professional learning networks. Edmodo learning analytics played a crucial role in the success of this study.
6.1.2 Edmodo Case Study 2: District Spotlight Chesterfield County Public Schools, Virginia
Edmodo helped the Chesterfield County Public Schools (CCPS) district support the “Design for Excellence 2020” strategic plan and scale blended learning. In early 2012, Chesterfield County Public Schools (CCPS) identified a need for a teaching and learning platform that could meet a variety of communication and instructional needs. The system must also integrate with existing platforms like Google Docs and it must be deployed in less than a year. CCPS found that teachers favored Edmodo because of peer recommendations and for its familiar and intuitive user interface, seamless communication between teachers and students, easy-to-build formative assessments, engaging educational apps, and accessibility from any device. The study involved 58,800 students, 4200 teachers, and 42 schools. Edmodo was adopted for increased student engagement as student experience with similar platforms meant that students quickly and easily embraced Edmodo. To start the process, CCPS established an Edmodo subdomain, which gave district administrators the ability to manage and support site usage by using Edmodo analytics, as well as foster district-wide communication and collaboration. They then trained 4200 teachers over the course of three days during summer break, in preparation for the 2012–2013 school year. With Edmodo′s free platform, CCPS now has a successfully executed blended learning strategy with increased student engagement and near-district-wide adoption. Building on this momentum, CCPS has scaled its blended learning efforts in the 2013–2014 school year through an expanded digital ecosystem in which Edmodo serves as the hub. The use of Edmodo data was instrumental to the success of this effort.
6.2 Knewton
The Knewton (2008) platform is a flexible, scalable system for delivering adaptive learning experiences and predictive analytics across arbitrary collections of content in different learning environments. Knewton processes student interactions within learning applications to personalize digital coursework and effectively reinforce class lessons. Knewton supports the learning process with three core services: recommendations for students, analytics for teachers and students, and content insights for application and content creators. Although adaptive tutoring systems are themselves not new, a traditional problem they face is that they are often bound to a single grouping of content. Even where they are not, adapting the tutoring system to a new collection of content is an expensive and time-consuming process. The Knewton platform builds on decades of research in adaptive tutoring systems, psychometrics, and cognitive learning theory, but also contains several key innovations that make it possible to quickly and efficiently integrate with new collections of content. This enables the benefits of adaptive tutoring to reach far more students across more domains more quickly. One of these innovations is the Knewton knowledge graph and its associated graphing ontology, which provides flexible and expressive ways to describe relationships between content. These expressive relationships are drawn from pedagogical reasoning and are intended to map easily to human intuition, which allows Knewton and its partners to quickly graph new content into an information-rich, machine-readable state. The resulting content graph is then used in conjunction with up-to-the-minute descriptions of students′ abilities determined by a real-time psychometrics engine to deliver intelligent, personalized content recommendations and analytics. Knewton scales these operations by employing a service-oriented architecture, which allows its inference engine to reliably and efficiently process concurrent activity from tens of millions of students. Knewton provides analytics for teachers to help manage class learning, as shown in Figure 3.

FIG. 3: Knewton Teacher Dashboard
6.2.1 Knewton Case Study 1: Arizona State University
Arizona State University (ASU) used Knewton technology to help more students succeed. Together, ASU and Knewton increased pass rates, reduced withdrawals, and advanced students faster through developmental math. With more than 70,000 students, ASU is the largest public university in the United States. As a research university committed to improving access to education, ASU was strained by the large number of enrolled students—each with diverse needs, interests, and educational backgrounds—who were not college-ready in mathematics, a key predictor of university success. ASU saw a high correlation between students who succeeded in developmental math and overall academic success. Students who earned an A, B, or C had 50% higher persistence rates (i.e., retention through graduation) than those earning lower grades. Unfortunately, more than 30% of students failed to receive a C or higher in ASU′s developmental math course. The ASU developmental math students now use Knewton Math Readiness, a developmental math course powered by the Knewton platform and aligned with the Common Core Standards for Mathematics. As students work through online math lessons, Knewton analyzes vast amounts of anonymized data to Figure out what a student knows and how they learn best. Then, Knewton recommends what concept in the course each student should study next, personalizing the educational experience and helping students at any level succeed. Knewton technology enables an entire class to work through material in a sequence and pace customized for each individual. As ASU′s students progress through their developmental math course, the Knewton platform analyzes data behind the scenes to continually assess students′ mathematical proficiency. Knewton then recommends what concept within the online course a student needs to work on next, creating a continuously updated and personalized learning path for each student. ASU′s faculty used Knewton′s real-time reports to detect gaps in knowledge, create adaptive study plans for each of their students, and focus lessons around concepts where students needed the most help. Students worked through the course at their own pace with their instructor′s guidance. Instructors can see which students are off track, search for individual student performance metrics, or view trends across an entire group of students to determine which concepts are most difficult across the board. The course goal is to complete the requisite number of lessons at a certain performance standard. Each student must also pass a final exam administered by ASU. After two semesters of use with over 2000 developmental math students at ASU, course withdrawal rates dropped by 56% and pass rates increased from 64% to 75%. Almost half of students finished the course four weeks early, allowing them to advance immediately to the next level on mastering course concepts. This is an example of using an analytics-driven learning system such as Knewton to improve student outcomes.
6.3 Classroom Salon
Classroom Salon (CS) is a learning content management system (LCMS) built around the concept of small learning groups called “salons.” The platform is built around a familiar social media metaphor by providing message boards, real-time activity streams, and continuous assessment of how a student is functioning relative to other students in the class. For example, the Salon Engagement Score (Figure 4) assess a student on four dimensions from student engagement (commenting activities), curiosity (asking questions), and helpfulness (responding to others questions) to consistency (how frequently student engage in learning activities). The score given in each category is a relative score indicating satisfactory (yellow), poor (red), and good (green). Based on the individual score, students can increase their activities in weaker areas to improve. The early evidence from a Princeton University based pilot indicates that student motivation to engage increases as they are provided with real-time analytics reports. Students used color-coded indicators as a way to improve the key areas such as course engagement, curiosity, helpfulness, and consistency.
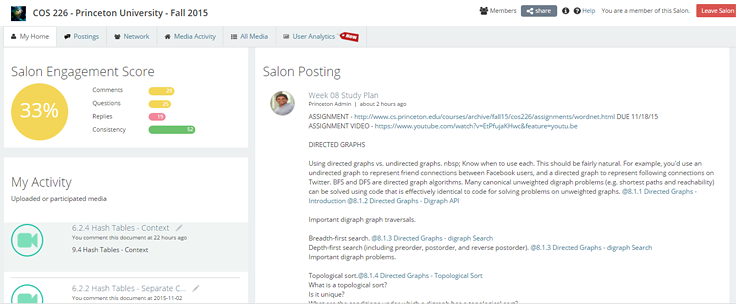
FIG. 4: Salon Home Page
CS takes a content-first approach to course design by recognizing that content, and how students interpret that content is one of the most important factors to consider in course design and delivery. For example, using local prompts (highlighted passages and video frames), instructors can engage students directly with content to improve communication and comprehension (Figure 5). These data then can be used for improved instructional methods.
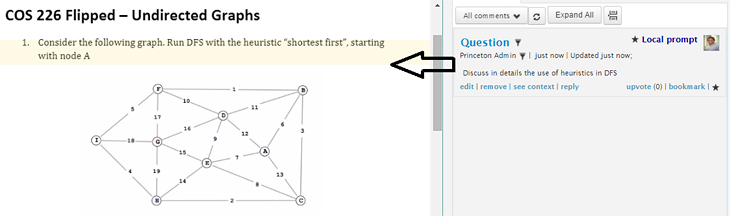
FIG. 5: An Example of a Local Prompt Presented as a Question
Students can highlight documents and annotate videos using instructor-defined tags such as “why I tagged this,” “I do not understand,” “I want to know more,” or “I find this interesting,” to indicate places of interest or confusion (Figure 6). The tagging allowed easy categorization of content that needs to be further discussed and clarified in class.
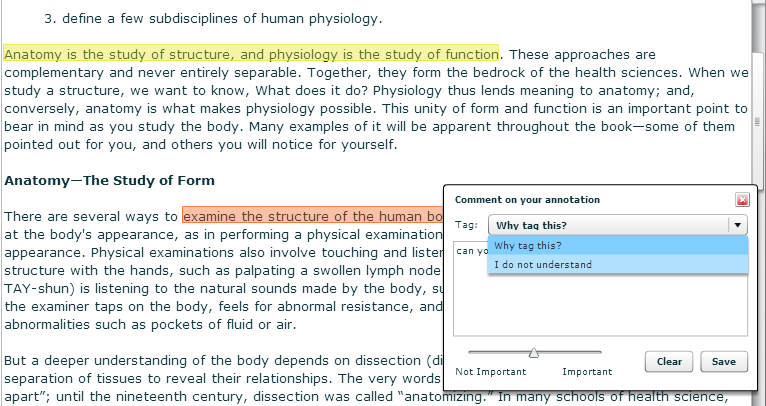
FIG. 6: Tagged Annotations to allow easy Classification
CS also encourages interaction among small groups of students that can form self-organized networks. Self-organized networks are dynamic groups that are self-selected by students themselves. Each student can work alone or as part of a self-organized group. Students can move in and out of groups, allowing them to find more compatible groups to join. Figure 7 shows a network of three students self-selected from 38 salon members. Instead of focusing on salon activities from all 38 members, students in the self-organized network can focus and learn from a smaller group of fellow students.
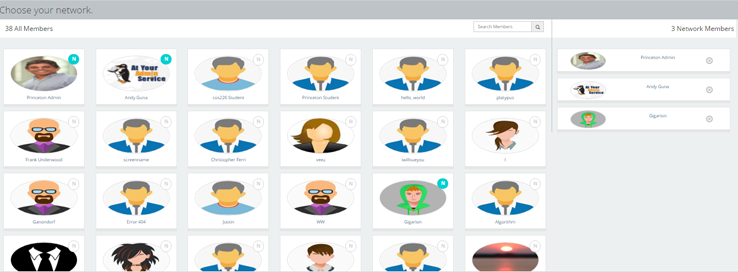
FIG. 7: Making Self-Organized networks
CS also aggregates student annotations (Figure 8) and provide analytics reports that shows how student activities (red curve) compared to class activities (blue curve).
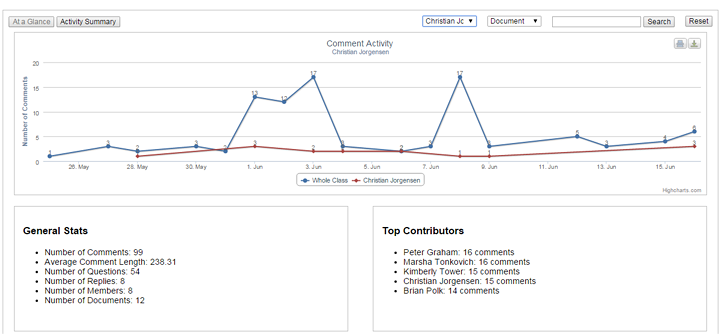
FIG. 8: Activity Timeline
A key challenge in data analytics is deciding how to interpret the data we see. Although many platforms provide data, educators often do not understand or have the time to interpret and use them for effective instructions. CS provides filters that can be used to quickly understand the important content based on social interpretation. For example, Figure 9 shows how to filter annotations by 279 students to find hotspots or places of great interest. These hotspots then become the discussion topics in class.
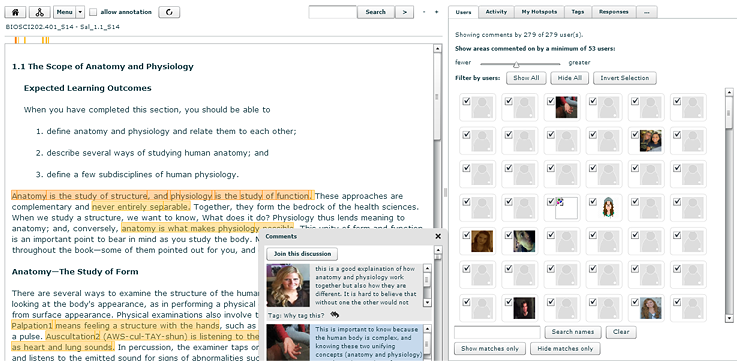
FIG. 9: Annotations Filtered by Hotspots
Modern analytics-driven systems (Knewton, 2008, Edmodo, 2008, CS, 2008) allow the design of the course based on what data are important to collect. For example, an instructor may decide to collect data on content that students found to be difficult. Instructors may also encourage social learning activities that can lead to data on how students interact with each other. In general, the design should take into account what analytics to collect and how to interpret them. It allows the teacher in charge of developing active engagement opportunities to understand how students comprehend course content. Tagging of content is another important area of analytics and discovery. For example, a tag distribution and user activity bubbles can indicate the need to address specific topics more than the others and to show which students are the thought leaders (bubbles in the middle of the chart) in the class (Figure 10).
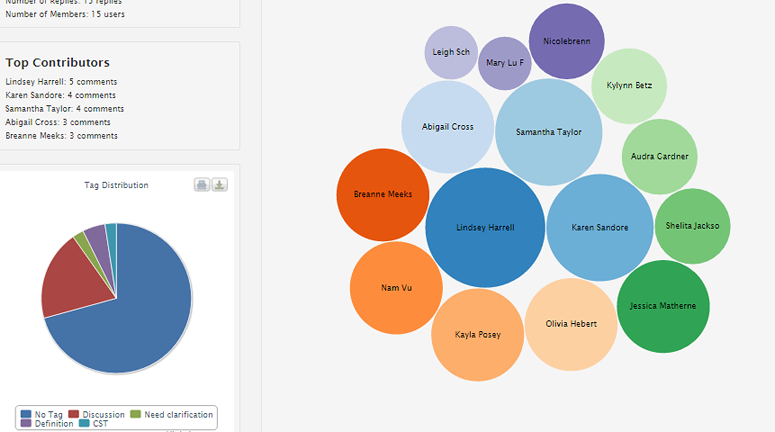
FIG. 10: Student Activity Chart on a Document
Figure 11 shows the participation and commenting trends in a specific document in CS (at a glance tab). The other tabs, such as user (Figure 11), provide access to individual actions by each student as well as threads (Figure 12) that were developed as part of the discussion.
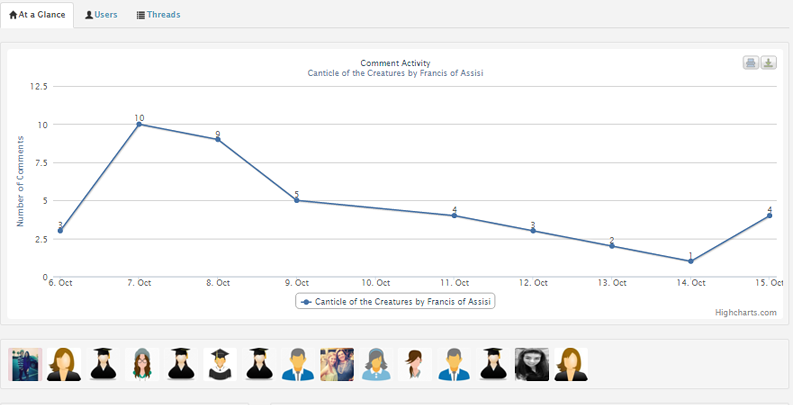
FIG. 11: Participation and Commenting Trends in a Specific Document
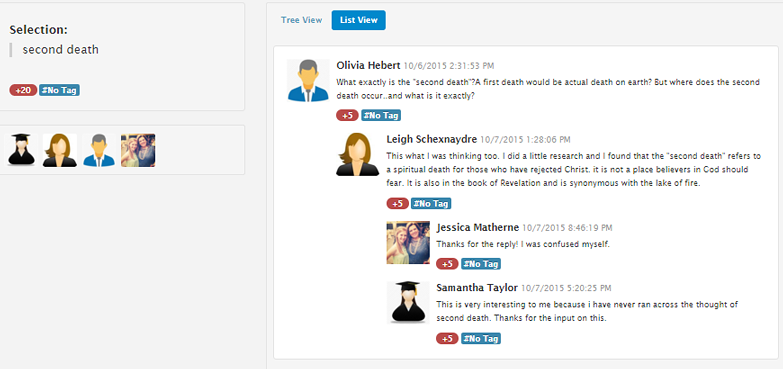
FIG. 12: Discussion Threads on selected text
6.3.1 Salon Case Study: University of Wisconsin-Milwaukee (Figure 13)
In 2011, CS was introduced to the University of Wisconsin–Milwaukee (UWM) as part of an Educause/Gates Foundation grant (Gunawardena and Kaplan, 2013). The goal was to rethink two large introductory science courses in biology and chemistry, and to improve access and success rate of students in these classes. The project was an example of a novel use of analytics to deliver better instructions. The problem of overcrowded classes is very familiar in higher education today. Overcrowded classes are not conducive to learning and instructors cannot simply provide any form of personalized attention to students. Hence, one of the best ways to scale education to large groups of students is to use analytics to understand the collective interpretation of course content and to provide customized instructions based on student annotations. In a biology class with nearly 600 students, each student was asked to read the book and annotate a few places to indicate where they find things interesting or confusing. Students were given participation credits for doing this activity of reading and annotations. Students do not see what others have selected while they annotate, and once the document is closed for annotations, instructor then can view the collective interpretation of content using CS tools. Figure 13 is an example of a sample chapter annotated by 279 students. Students annotated the text individually and the aggregated analytics are only available to the instructor.
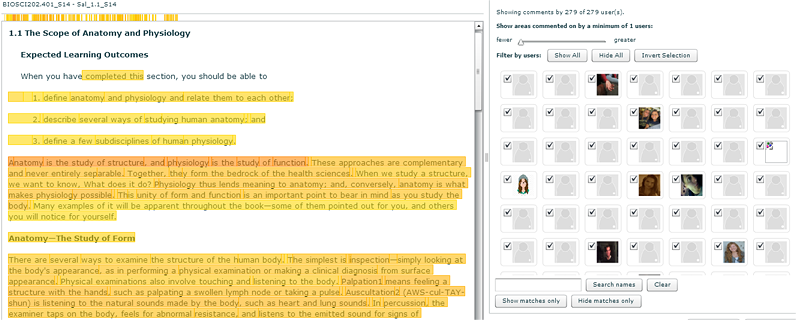
FIG. 13: A Sample Chapter Annotated by Large number of Students
Using a CS slider that allows the instructor to filter comments, the instructor can quickly focus on, for example, the places marked by a large majority of students (53+, as shown in Figure 14). These sections then become the focus of discussion for the instructor and cliff notes of study for the student. Instead of teaching a generic set of topics to students, instructors can use CS to streamline instructions and answer the most pressing issues as shown by student annotations.
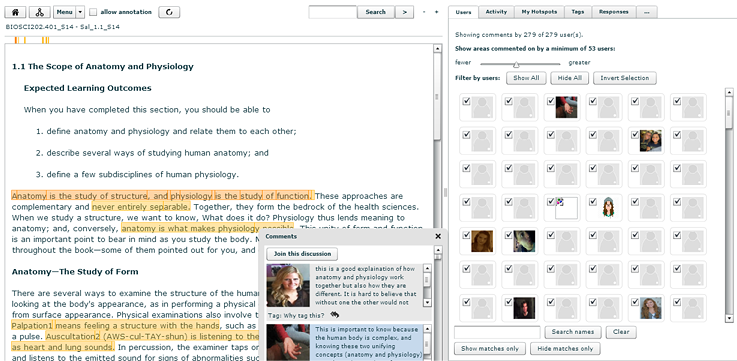
FIG. 14: Filtering Annotations to Visualize Common Hotspots of 53 or more students
6.3.2 Villanova University
Professor Markus Kreuzer teaches Political Science at Villanova University. His novel approach to using analytics include, a crowdsourced student assessments that draws from the large benefits of collaborative learning. It also eliminates the difficulty of managing student project groups. Students were able to contribute to the group discussion in three ways: posting sample answers, raising questions that seek to clarify aspects of the assignment, or asking for clarifications regarding some of the readings or videos that relate to the particular assignment. Students were also able to respond to posts by their colleagues and provide constructive, substantive feedback. Using CS analytics graphs, Professor Kreuzer was able to assess the progress, as shown in Figure 15.
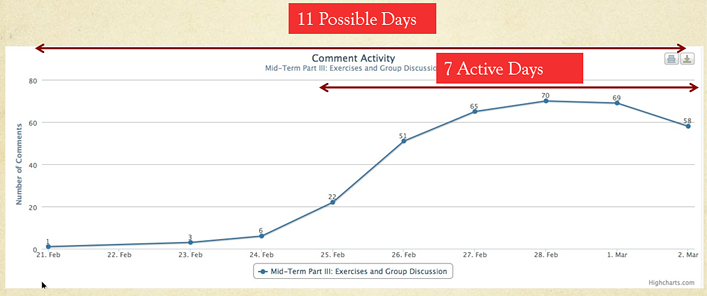
FIG. 15: The Activity Graph of the Mid-Term Group Discussion Document
Student contributions were evaluated in the following ways: number of posts, regularity of posts (i.e., posting a few comments on several occasions contributes more than posting a lots of comments on one occasion), how often student replied to other posts (i.e., this means that student is listening and providing feedback), how many people replied to their posts (i.e., this means that student raised important question that will help others), and number of up votes (indicates that others found their contributions helpful). Using CS analytics, the instructor was able to access valuable information on student engagement and persistence, as shown in Figure 16. Each line in the following table corresponds to one student record.
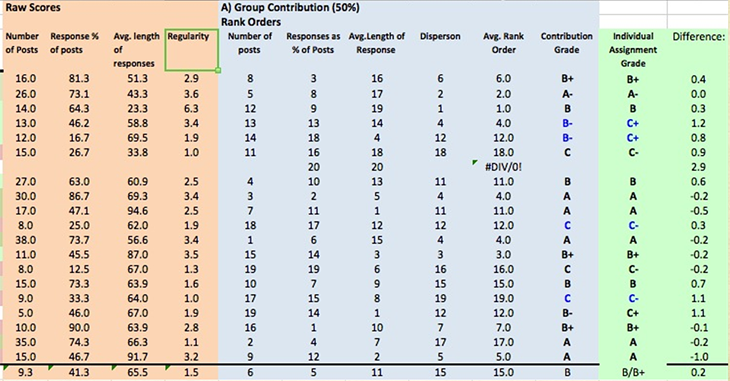
FIG. 16: The Class Activity Table
As students discuss content more, they lead to conversation structures that can lead to self-organizing groups. These groups can then work more efficiently to provide better outcomes. Once again, this was made possible by deep analytics from CS that discovers latent relationships among students (Figure 17).
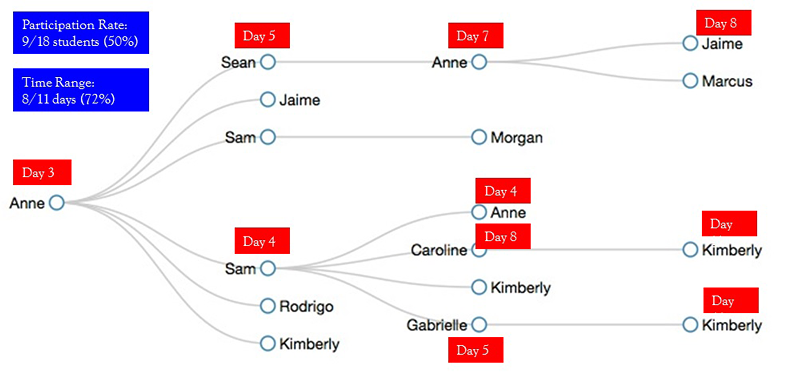
FIG. 17: A conversation tree as shown by CS analytics
The use of analytics in his course made better understanding of student behavior and latent group behavior patterns that are difficult visualize without the aid of technology.
Figure 18 shows student engagement in the salon, and the data were used by a predictive analytics model to help instructors understand the student′s potential for success or risk of failure, well in advance. Another benefit to these types of analytics was that it enabled the instructor to measure intangibles such as leadership, helpfulness, engagement, and consistency of participation, all of which are critical indicators of student success or risk of failure.
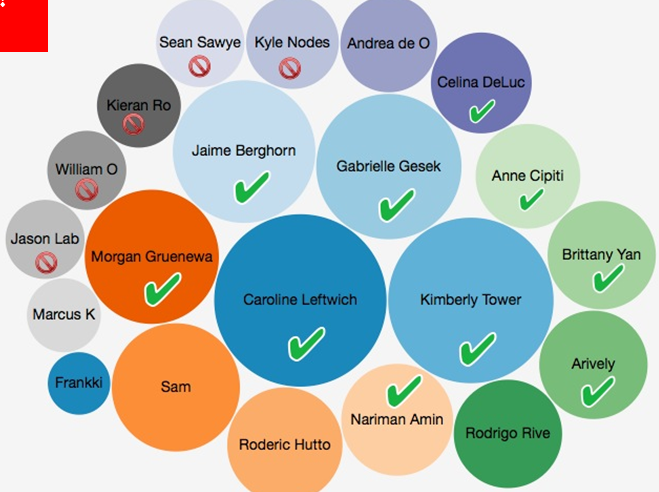
FIG. 18: Participation bubble of each student
6.3.3 Princeton University
In spring 2015, Princeton University used CS as the platform to deliver a computer algorithms course. A flipped lecture was offered as an alternate to traditional lecture. While traditional lecture students met twice a week, flipped students met only once a week. Flipped students were responsible for watching instructional videos, responding to questions, and commenting on places of interest. The analytics generated from student interactions were critical to the success of the flipped model, despite the fact that it only had one meeting per week. For example, the instructor was able to access the tag distribution prior to the class to understand which sections needed to be discussed further (Figure 19).
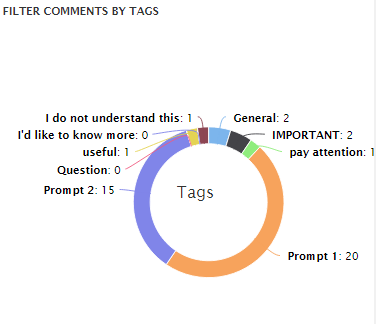
FIG. 19: A tag distribution of comments
Moreover, the course analytics showed (Figure 20) how a particular concept was actively accessed by students compared to all activities. As shown in the graph (red line), the video of “11.3 binary search trees—deletion” was only accessed by students during a limited period, indicating less importance or triviality of the concept to students. On the other hand, some content videos were accessed throughout the semester and hence were important to be discussed during final exams and review sessions. The experiment was conducted using two groups, namely, one group who attended traditional lectures and another group who met only once a week and mostly learned from videos and using CS. The analysis of data indicated that the learning outcomes from two groups, traditional (n = 208) and flipped (n = 23), were almost identical (Figure 21) indicating that it is possible to obtain similar learning outcomes by combining less human resources and using deep analytics.
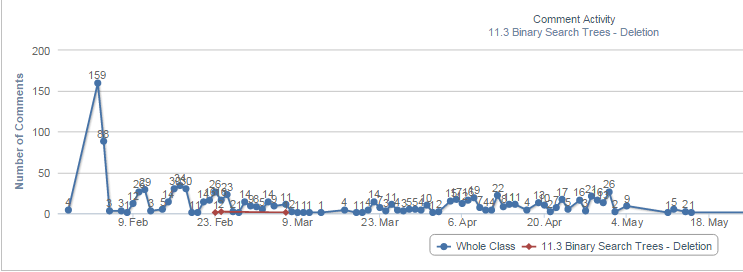
FIG. 20: Access patterns of a specific video during a semester

FIG. 21: A comparison of performance in analytics driven flipped class (red) versus traditional class (blue)
7. FUTURE POTENTIAL FOR ANALYTICS-BASED EDUCATION
We conclude this paper with a discussion of the future potential for analytics-based education. Analytics, or the effort to create interpretation from data, will continue to get attention from educators and administrators throughout the world. Learning analytics help revise curriculum, provide better teaching, and improve assessment in real time (Johnson et al., 2011). More and more learning management systems will provide dashboards that can be used to get a snapshot of the state of a course. Systems like Purdue University based Course Signals (Course Signals, 2009) or Carnegie Mellon University based Classroom Salon (Classroom Salon, 2008) will alert instructors when a student is falling behind. The intelligent tutoring system based platforms like OLI (Open Learning Initiative, 2001) will continue to guide the learners through a path based on what the system thinks is the next best thing to do to advance. Innovations in analytics in education will come from individual instructors who can now use modern tools such as Classroom Salon, Edmodo, or Knewton to design, deliver, and use the data to improve instructions. Sometimes, the interpretation of data at the macrolevel can be difficult. Therefore, third party predictive analytics companies will provide services to educational institutions that are trying to interpret the data. For example, in one recent study at American Sentinel University, the data predicted that if a student completes half the curriculum, they are 99% more likely to complete the degree. This is valuable data to the institution to minimize student dropouts by providing more support during the first half of their study. There is no magic bullet in educational analytics. Creating a better learning environment and obtaining good outcomes is a complex task. When a student fails a course, or does not submit an assignment, or does not attend class, the reasons can be much more complex than just the educational data analytics. But educational analytics provide a way to “know” without any formal assessments. Sometimes it is better to know than to measure. Formative assessments like tests and quizzes do not always tell the whole story. Instead, student data must be available on a daily basis and data must be more granular than just the login time to a system or access of course media. We need to know what documents students are accessing and how they are consuming them. The “how” question is more important than what they access. We believe educational platforms will evolve to provide more comprehensive and continuous data. Classroom Salon, Edmodo, and Knewton are some examples, where each day students are informed of where they stand in the class compared to class average. In CS, for example, instructors know what content pieces students really care about or have difficulty understanding. In flipped classes, the role of analytics becomes even more important. If the instructor knows which sections students are having trouble with, those concepts can be addressed effectively and efficiently. The key is to capture good data that can help display hotspots of activities. One key question that still needs to be addressed is the privacy of data. How can we balance privacy while using data to make good teaching decisions and help students navigate through courses?
One other thing is clear. With the availability of Google, Wikipedia, and YouTube, we no longer understand how or when students really “learn.” Therefore, future educational systems must find ways to integrate with other data sources such as Google, Wikipedia, or YouTube to create a more global picture of the learner.
All in all, we think that analytics-driven learning will dominate education in the coming years. It will allow faculty resources to be efficiently allocated to teaching and learning. Analytics can only create better outcomes in education and we remain hopeful that analytics will significantly drive educational outcomes and reduce the cost of education. We encourage educators to innovate on how they use analytics in their teaching. As you invent new ways to teach using analytics, submit a paper to this journal to be published in the future.
REFERENCES
Arnold, K.E., Signals: Applying Academic Analytics, EDUCAUSE Quarterly, vol. 33, no. 1, http://bit.ly/29WeYDw, 2010.
Blackboard Learn, http://blackboard.com, 1998.
Blecking, A., Classroom Salon – An Innovative Method for Investigating Student Learning, http://pubs.acs.org/doi/pdfplus/10.1021/bk-2014-1182.ch010, 2014.
Brown, M., Learning Analytics: The Coming Third Wave, EDUCAUSE Learning Initiative Brief, http://bit.ly/29UlpWk, 2011.
Campbell, J.P., Oblinger, D.G., Academic Analytics, EDUCAUSE white paper, http://bit.ly/2a16GdZ, 2007.
Classroom Salon – Interpretation is social, http://classroomsalon.com, 2008.
Cloud Computing in Education, http://bit.ly/12uN233, 2014.
Course Signals, Teaching and Learning Technologies, Purdue University, http://www.itap.purdue.edu/learning/tools/signals/, 2009.
CourseSmart, online textbooks and course materials, http://www.coursesmart.com/, 2007.
Dawson, S., McWilliam, E, Tan, J.P., Teaching Smarter: How Mining ICT Data Can Inform and Improve Learning and Teaching Practice, in Hello! Where Are You in the Landscape of Educational Technology? Proceedings ascilite Melbourne, http://bit.ly/2ahpffM, 2008.
eCollege – http://ecollege.com, 1996.
Edmodo – Connect with Students, http://edmodo.com, 2008.
Gates Foundation, http://www.gatesfoundation.org/, 2000.
Google: Computer Science Capacity Awards, http://bit.ly/29O5fgh, 2015.
Gunawardena, A., Kaplan, N., A Socially-Centric Blended Learning Model for at Risk Youths in an Urban Institution, Project funded by Next Generation Learning Challenges, http://www.cs.cmu.edu/~ab/Salon/research/uwm/final%20report%20of%20classroom%20salon%20implementation%20at%20UWM.pdf, 2013.
Hawkins, B.L., Accountability, Demand for Information, and the Role of the Campus IT Organization, in R. N. Katz (Ed.), The Tower and the Cloud, pp. 98–104, 2008.
Johnson, L., et al, Horizon Report. 2013 Higher Education Edition, http://bit.ly/2a9QoQB, 2013.
Johnson, L., Smith, R., Willis, H., Levine, A., Haywood, K., The 2011 Horizon Report, Austin, TX: The New Media Consortium, http://bit.ly/2a17bES, 2011.
Kaufer, D., DocuScope: Computer-aided Rhetorical Analysis, https://www.cmu.edu/hss/english/research/docuscope.html, 1998.
Knewton – An Adaptive Learning Company, http://knewton.com, 2008.
Lee, M.H., Runde, J., Jabril, W., Wang, Z., Brunskill, E., Learning the Features Used to Decide How to Teach, Learning at Scale 2015. Work in Progress paper, 2015.
Luan, J., Data Mining Applications in Higher Education, SPSS Executive Report (DMHEWP-1004), http://bit.ly/29UlSrK, 2004.
Ma, J., Han, X., Yang J., Cheng, J., Examining the necessary condition for engagement in an online learning environment based on learning analytics approach: The role of the instructor, Internet and Higher Education, vol. 24, pp. 26–34, 2015.
Norris, D., Baer, L., Offerman, M., A National Agenda for Action Analytics, National Symposium on Action Analytics, St. Paul, MN, September, 2009, http://bit.ly/29ZNVs9.
Open Learning Initiative (OLI), Carnegie Mellon University, http://oli.cmu.edu/, 2001.
Piazza, Q&A platform, https://piazza.com, 2011.
van Barneveld, A., Arnold, K.E., Campbell, J.P. Analytics in Higher Education, EDUCAUSE Learning Initiative, ELI Paper, 2012.
Wankel, L., Blessinger, P., Increasing Student Engagement and Retention using Online Learning Activities, ISBN 978-1-78190-238-7, Emerald Group Publishing: United Kingdom, 2012.
Wikipedia, https://en.wikipedia.org/wiki/Analytics, 2001.
Wikipedia, Business Analytics, https://en.wikipedia.org/wiki/Business_analytics, 2001.
-
Gander Tim, 978-981-13-2262-4_137-1, in Encyclopedia of Educational Innovation, 2019 Crossref (open in a new tab)
-
Gander Tim, Learning Analytics in Secondary School, in Encyclopedia of Educational Innovation, 2020 Crossref (open in a new tab)
-
Starčič Andreja Istenič, Vukan Milena, Teachers' perception of data-driven school ecosystem and data analytics, Proceedings of the 10th International Conference on E-Education, E-Business, E-Management and E-Learning - IC4E '19, 2019 Crossref (open in a new tab)
-
Al-Jayyousi Odeh, Aldhmour Fairouz M, Re-imagining the Futures of University: Foresight for Higher Education Using Innovation Labs Learning Space, in Explore Business, Technology Opportunities and Challenges After the Covid-19 Pandemic, 495, 2023 Crossref (open in a new tab)
Comments
Show All Comments