Computer-marked assessments to enhance learning in engineering education
School of Engineering, Deakin University, Geelong, Australia, Email: k.ghabraie@deakin.edu.au, ORCID: 0000-0002-1043-3403
In many of the early technical subjects in engineering courses, assessments can be designed to be automatically marked by computers. Computer-marked assessments are particularly suitable for online and blended classes due to their flexibility and for large classes as they eliminate the time required for marking. However, their positive impact on learning experience of students can vary significantly depending on their design. This paper presents the results of an investigation into the effectiveness of a particular online computer-marked quiz on studentsʼ learning. This quiz was used as the first assessment item in a second-year core civil engineering course in an Australian university over the course of five years, from 2011 to 2015. The positive impact of the quiz on learning is justified through an analysis with reference to the literature. This conclusion is further substantiated by studying the changes in studentsʼ marks and their perception of the quizʼs impact on their learning compiled based on anonymous survey results. In the end, based on the observations and analyses reported in the paper, suggestions are proposed for design of computer-marked assessments to support studentsʼ learning.
KEY WORDS: computer-marked assessment, online quiz, engineering education
1. Introduction
Frequency of assessments and feedback is one of the conditions which can improve the impact of assessments on learning as explicitly mentioned in earlier works, like Black and Wiliam (1998) and Gibbs and Simpson (2005). In fact, assessment is known to have more positive impact on retention than further study even in the absence of feedback; a phenomenon called the testing effect (Roediger III and Karpicke, 2006). The main barriers towards designing and using frequent assessment and feedback are limitations in time and resources. Incidentally, one of the characteristics of the 21st century is increased number of students and reduction in resources (Kirkwood and Price, 2005) further restricting the implementation of frequent assessments and providing frequent and timely feedback. However, this century also presented prevalent access to personal computers and digital technologies (Kirkwood and Price, 2005). If used properly, such technologies can help educators providing successful assessment items.
In a number of subjects in early levels of science, technology, engineering, and mathematics (STEM) disciplines, the ability to select and apply the appropriate procedures to solve well-defined problems is one of the key intended learning outcomes. Following the Structure of the Observed Learning Outcome (SOLO) taxonomy (Biggs and Collis, 1982), this would fall into multistructural and relational levels of understanding [see e.g. Biggs and Collis (1982), pp. 23–28, or Biggs and Tang (2011), pp. 123–124].
Solving the aforementioned well-defined problems requires following certain series of steps and/or calculations: certain algorithms. Given computersʼ ability to follow algorithms precisely, such problems can be solved by computers. Furthermore, proposed solutions to such problems can be evaluated by computers.
Computer marked assessments (CMAs) have been used in higher education in STEM disciplines both as formative and summative assessments (Bälter et al., 2013; Burrow et al., 2005; Callear and King, 1997; Conole and Warburton, 2005; Jordan, 2014). Apart from almost eliminating the marking workload, CMAs can be designed to provide instantaneous feedback which is both objective and unbiased. Integrated with online learning management systems (LMS), they also provide a flexible platform allowing students to complete the assessment task asynchronously (Jordan et al., 2011).
A drawback of using CMAs is the time and effort required to set up a reasonably sized question bank and possibly predefining required feedback to common mistakes by students. However, the large amount of time spent on designing quizzes is worth the effort. Another point to remember regarding this time investment is that one does not necessarily need to spend it in one go, but can distribute it over periods that one is not overly occupied with other tasks (Jordan, 2014).
Another barrier in adopting CMAs by academics seems to be lack of institutional support, confidence, or expertise in design. For example, the approach the author took in designing his CMAs involved computer programming in different languages. Lack of expertise in computer programming in teaching teams, however, can be resolved by employing professional computer programmers. General factors contributing to seemingly slow takeup of CMAs have been discussed by Sim et al. (2004) and Jordan (2014).
This paper focuses on the results of implementing an online computer-marked quiz designed and used by the author in a second-year civil engineering unit on geology and geomechanics in blended classes where more than two-thirds of students were off-campus. After providing a general background introducing the context and design of this quiz in the next section, different aspects of the quiz are analyzed and compared with respect to earlier works in the literature with a focus on the effects of the quiz on studentsʼ learning. This follows with results of student surveys and mark distributions demonstrating the impacts of this online quiz and supporting the results of the earlier analysis. The paper concludes with some suggestions towards designing more effective CMAs.
2. Background
The course of concern in this paper was taught by the author and other colleagues at the University of Southern Queensland, Australia from 2010 to 2015. Enrolments in this unit are shown in Table 1. External students formed the majority of students in this unit as shown in this table.
TABLE 1: Statistics for the course and its first assessment task from 2010 to 2015
| First assessment item | Assignment | Online quiz (CMA) | ||||
| Year | 2010 | 2011 | 2012 | 2013 | 2014 | 2015 |
| Enrolments | 261 | 270 | 152 | 219 | 179 | 193 |
| % of external students | 74 | 79 | 73 | 75 | 68 | 68 |
| Weight of 1st assessment (%) | 10 | 5 | 5 | 10 | 15 | 15 |
| Average mark (%) | 83.0 | 73.1 | 76.8 | 87.8 | 83.2 | 79.0 |
| Participation rate (%) | 87.4 | 93.3 | 94.7 | 97.7 | 100 | 97.9 |
In 2010, the first assessment item in the geomechanics part of the course was a simple problem-solving task which was constituted of four numerical problems covering basic soil characterization. Considered as minimum required skills, it was expected that the class average mark in this assessment item would be in the distinction range, i.e., more than 70%. The average mark for this assessment item in 2010 was 83%. The computer-marked online quiz was first implemented in 2011 replacing this problem-solving assessment.
The initial design of the quiz included 12 questions which had to be answered in 45 min. Questions were all short-answer questions (constructed-response) except for one multiple choice question (selected-response). In terms of complexity of the questions, the quiz questions were similar to the preceding problem-solving task. Figure 1 shows three examples of quiz questions.
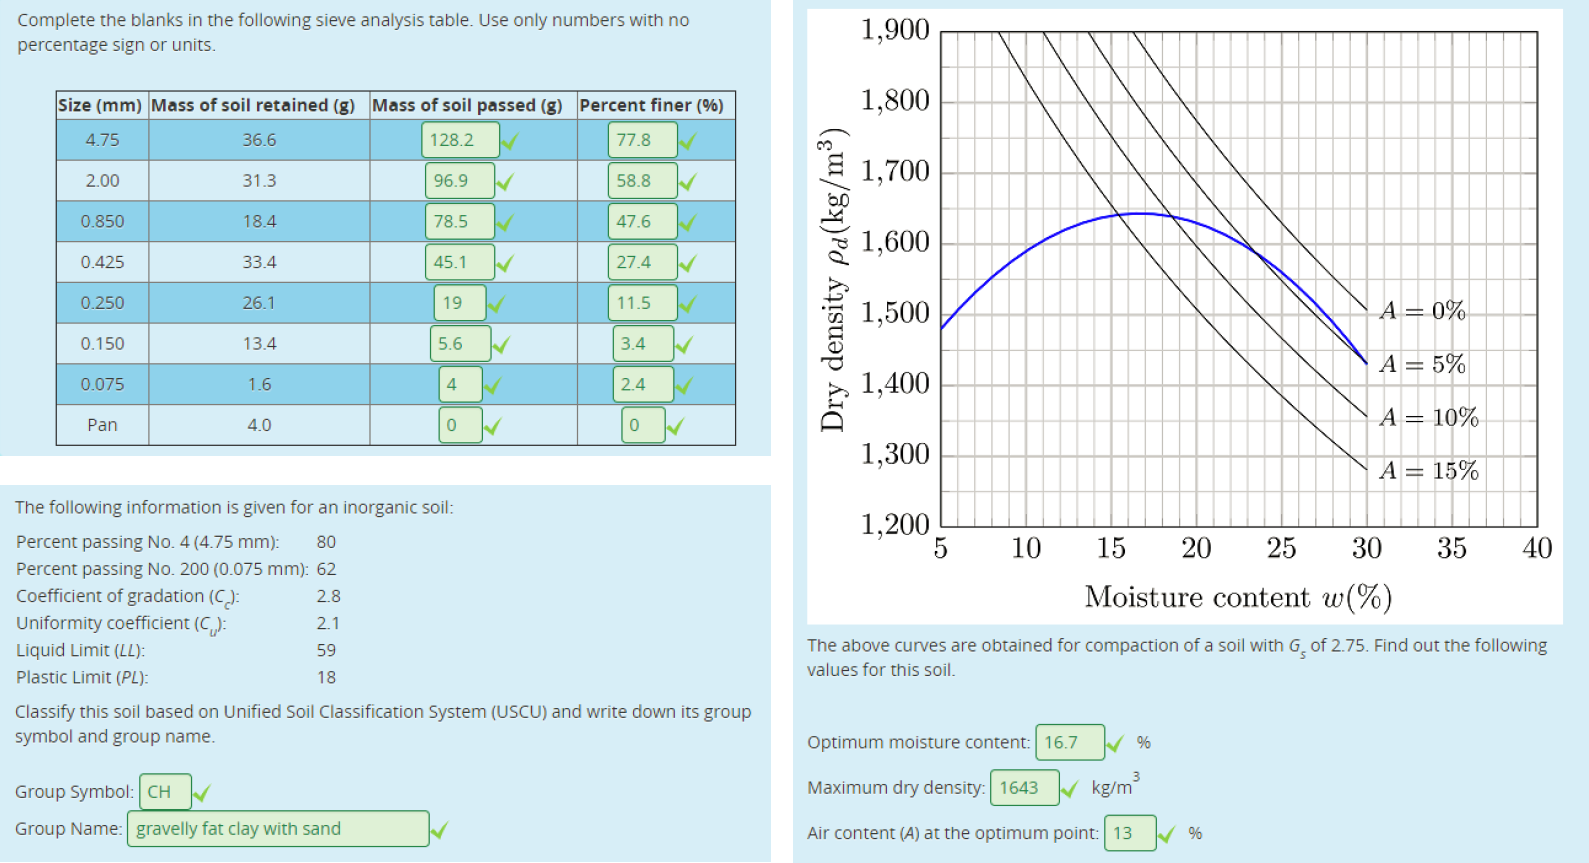
FIG. 1: Examples of question types used in the quiz
The questions were designed to measure the following intended learning outcomes:
- Solve problems relevant to basic soil properties and phase relationships.
- Classify soils according to classification systems.
- Analyze particle size distribution and compaction graphs.
The action verbs are relevant to multistructural and relational levels in SOLO taxonomy (Biggs and Tang, 2011, Table 7.1).
A reasonably large bank of questions was developed and imported into Moodle † with up to 90 variants for each question. Question variants were mostly created using Fortran and Matlab codes allowing mass production and simplifying further development. All question variants were checked to make sure given values and expected answers are in realistic ranges.
Moodle quiz engine was used to manage the online quiz and to randomize the questions and their variants. Students were allowed to have nine attempts at the quiz in the first two years which was later increased to 10 attempts from 2013 onwards. Upon submitting each attempt, students received their mark and were notified of the correctness of their answers to each part of each question. The quiz was open for at least one week. After closing, studentsʼ best marks were recorded as their mark for this assessment item. To encourage studying, after each attempt, students had to wait for at least one hour before being able to have another go at the quiz.
As shown in Table 1, the weight of the quiz was 5% in 2011 and 2012. Lowering the weight of the first assessment item from 10% in 2010 was mainly due to the teaching team being a bit hesitant about the possible implications of the new format of this assessment. Following the observations in the first two years of implementing this CMA, its weight was increased to 10% in 2013. In 2014, eight geology questions were added to the quiz increasing the number of questions to 20. Following this change, the weight of the quiz was increased to 15% and the time limit for each attempt was increased to 120 min.
3. Assessments as learning tools
Assessment items are arguably one of the most important aspects of a course. In fact, the classical works of Becker et al. (1968), Miller and Parlett (1974), and Snyder (1971) have led to the conclusion that students are influenced by the assessment more than the teaching (Gibbs and Simpson, 2005). Given the importance of assessments in studentsʼ point of view, to enhance their learning experience one can start with enhancing assessments. As mentioned above, in the concerned course, the skills assessed in the quiz were deemed critical, so improving studentsʼ learning was one of the main objectives in designing this quiz.
3.1 Formative or Summative?
Assessments can be used to both form the learning (formative assessments) and measure it (summative assessments). The common consensus is that formative assessment is an “assessment for learning” while summative assessment is the summary which cannot be improved due to finality of grade. The interrelationship between these two forms of assessments has been discussed in Wiliam and Black (1996). Jordan (2014) notes a confusion in the use of formative and summative terms in the literature and emphasizes that these terms are not opposite. In other words, one can think of a summative assessment which is also formative; an assessment of learning and for learning. The implemented quiz design fits this definition as the multiple attempts allow students to receive feedback and improve without necessarily losing marks.
3.2 Conditions for Assessments to Support Learning
Gibbs and Simpson (2005) proposed 10 conditions for assessments to support studentsʼ learning. They grouped these conditions into two groups, first of which aim for improving the volume, focus, and quality of studying and the second look at improving feedback. The importance of both of these improvements on learning are of course supported by literature. The Seven Principles to Good Practice in Undergraduate Education (Chickering and Gamson, 1987), for example, puts emphasis on “time on task,” prompt feedback, communication of high expectations, and respect diverse ways of learning which are satisfied through conditions proposed by Gibbs and Simpson (2005). These conditions are listed in Table 2.
TABLE 2: The 10 conditions listed by Gibbs and Simpson (2005) and how well the quiz meets them: *** = very well, ** = well, * = to some extent
| Condition | Met? | |
| 1 | Sufficient assessed tasks are provided for students to capture sufficient study time | *** |
| 2 | These tasks are engaged with by students, orienting them to allocate appropriate amounts of time and effort to the most important aspects of the course | *** |
| 3 | Tackling the assessed task engages students in productive learning activity of an appropriate kind | ** |
| 4 | Sufficient feedback is provided, both often enough and in enough detail | * |
| 5 | The feedback focuses on studentsʼ performance, on their learning and on actions under the studentsʼ control, rather than on the students themselves and on their characteristics | ** |
| 6 | The feedback is timely in that it is received by students while it still matters to them and in time for them to pay attention to further learning or receive further assistance | *** |
| 7 | Feedback is appropriate to the purpose of the assignment and to its criteria for success | ** |
| 8 | Feedback is appropriate, in relation to studentsʼ understanding of what they are supposed to be doing | * |
| 9 | Feedback is received and attended to | *** |
| 10 | Feedback is acted upon by the student | *** |
Table 2 also shows how well the quiz meets each of the proposed conditions by Gibbs and Simpson (2005). In the sequel, the ratings in Table 2 are substantiated by discussions.
3.2.1 Conditions 1 and 2
These conditions are satisfied very well by the quiz. The first condition is mainly concerned with increasing time on task which is known to improve learning.
The exact time that students spent on this assessment item cannot be found. However, given that the questions faced in each attempt were different from the previous ones and required dedicated time to be solved again, it is reasonable to assume an increase in time on task compared to a traditional assignment.
The results show that on average, students attempted the quiz four times ‡. Given that the questions faced in each attempt were different from the previous ones and required dedicated time to be solved again, the average number of attempts itself clearly demonstrates a significant increase in time on task compared to a traditional assignment. A simple analysis of the time spent on this CMA is provided below based on the logs recorded by Moodle.
Condition 2 focuses on ensuring more time is spent on important aspects of the course. As mentioned before, the topics assessed in the quiz were deemed essential and the skills required to solve them were mostly considered among the minimum requirements of the course. Hence, directing students to spend more time on this aspect of the course was indeed intentional. Considering the small weight of the quiz, the amount of time spent by students on the quiz was surprisingly high. The unexpected motivation observed in students who spent seemingly hours just to marginally improve their marks is worthy of another investigation in its own right. The high level of motivation observed seems to be explainable by the notion of ipsative assessments (Hughes, 2011).
3.2.2 Condition 3
This condition requires the assessment items to engage students in appropriate and productive learning activities. The questions in the quiz directly assess the three aforementioned intended learning outcomes. As such, it can be reasonably assumed that the quiz guides the students to engage in appropriate learning activities relevant to these learning outcomes leading to the conclusion that this condition is satisfied well by the quiz.
3.2.3 Condition 4
This condition is concerned with providing detailed and frequent feedback. The fact that students receive marks indicating the correctness of their answers in each part of each question right after submitting each attempt and the allowance of multiple attempts satisfies the required frequency of the feedback fairly well. However, the binary nature of the marks means that the feedback is not necessarily detailed.
Overall, it seems that this condition can only be met by the quiz to some extent and additional supporting measures are needed to improve the quiz in this aspect.
3.2.4 Condition 5
This condition requires the feedback not to be offensive. This condition is met well as the nature of the feedback provided in the quiz is limited to response accuracy.
The feedback provided by the quiz can be considered objective and free from bias as it is marked by a computer. As stated in Sim et al. (2004), the emotional and subjectivity issues can be removed in CMAs due to automatic marking. Also, the deterministic nature of the problems used in the quiz removes the subjectivity. As discussed in Jordan (2014), one of the benefits of CMAs is that if designed properly, they can provide more reliable and free from bias marks compared to assignments marked by tutors or lecturers.
3.2.5 Conditions 6 and 7
These conditions require the feedback to be timely and relevant. The fact that the feedback students receive is on similar type of questions they are going to be asked again in the next attempt approves the relevance of feedback here. Indeed this feedback is timely as they receive it while they are in the process of completing the assessment task. So, it still matters to them and it is in time for them to put in more effort or ask for help. Overall, both of these conditions are met well by the quiz.
3.2.6 Condition 8
This condition requires that the feedback advises students on what they should do. The binary feedback students receive upon submitting an attempt tells them which questions (or parts of questions) they did wrong. Students can then go back to relevant teaching material or seek further assistance based on this information. Hence this condition can be satisfied well by the quiz only for questions where the binary feedback is detailed enough.
3.2.7 Conditions 9 and 10
These conditions focus on studentsʼ reception and reaction to the feedback. This might seem to be not necessarily controllable by the quiz design. However, the positive motivational effect of the quiz is certainly relevant here. The strong evidence of mark improvements in later attempts which is discussed in following sections demonstrate that these conditions are met well by the quiz.
3.3 Remarks Based on the Above Analysis
In summary, all of the conditions are satisfied well or very well except for conditions 4 and 8. This is due to the limited details in the automatically generated feedback. Before further discussion, that there is supporting evidence in the literature that even CMAs with minimal feedback can have positive impact on studentsʼ learning [see, e.g., Bälter et al. (2013)]. However, here the intention is to discuss possible strategies to improve this situation.
Looking at the comments left by students in surveys, questions in which the intermediate answers were not included in the assessment and students had to do a number of steps before coming to the final answer were the ones in which students felt more feedback would have been helpful. For example, comparing the table completion questions (Figure 1, top left) with classification questions (Figure 1, bottom left), only the feedback received on the latter was considered inadequate. In other words, even a binary mark may be considered as a detailed enough feedback as long as students could receive marks for intermediate steps in solving a problem. However, breaking a problem into sub-problems to provide corrective feedback on intermediate steps could defeat the purpose of the assessment by revealing the required solution steps to students.
To improve the feedback details, in some instances, it is possible to predict common mistakes and incorporate appropriate feedback for them when designing the quiz. Such improvements may be appreciated by students who might be surprised by receiving a seemingly smart feedback from computer. For example, consider the following comment left by a student in one of the anonymous surveys:
The feedback was good. For example I calculated the density instead of unit weight in one attempt. The computer actually told me this is where I went wrong which was helpful and impressive…
However, capturing all such situations is almost impossible. Following the experience of this quiz, the author believes that by systematically studying the wrong answers and identifying similarities in them after each implementation, the feedback aspect of the quiz can be improved.
It is of course easy enough to include comments to inform students which part of the study material they should refer to to improve their performance in a particular question. Such additional comments would be more relevant to condition 8.
The deficiency of minimal feedback can be also eliminated by ongoing support from the teaching team during the quiz as was exercised in this quiz. In our practice, the students were encouraged to seek further feedback from the teaching team by discussing the questions with them and possibly sending them their calculations and workings for more detailed feedback if needed. This strategy also aligns with the 4th principle among the seven listed by Nicol and Macfarlane-Dick (2006) for good feedback practice – namely encouraging teacher and peer dialogue around learning. Another important benefit of this openness is finding possible errors in questions.
Overall, it seems that the explained quiz design complemented with ongoing support from the teaching team can satisfy all the conditions listed by Gibbs and Simpson (2005), suggesting that it can be expected that this quiz has positive impacts on studentsʼ learning. This is in line with previous studies and conclusions made by several authors that allowing multiple attempts in CMAs can enhance studentsʼ learning (Bälter et al., 2013; Jordan, 2014; Thelwall, 2000).
In the following section, studentsʼ results in the quiz and their responses to anonymous surveys are studied to further substantiate this conclusion.
4. Results
The data used for discussions and conclusions in this section are openly available at Figshare (Ghabraie, 2018).
4.1 Studentsʼ Marks on the Quiz
The quiz directly measures the aforementioned three intended learning outcomes, hence the marks obtained in the quiz can be considered as good indicators of studentsʼ learning. Mostly concerned with minimum standards, the marks were expected to be high in the quiz, as was in the initial problem-solving task which was replaced by the quiz. Table 1 shows that the average marks did not significantly change after implementing the quiz.
In this section the changes in mark distribution over subsequent attempts are studied. Although the quiz records the best attempt for each student, in order to study the effect of reattempting the quiz on studentsʼ mark, the marks analyzed in this section are the marks for each single attempt. The 2011 results are not included as Moodle logs for the quiz in 2011 were erased from the server before the author downloaded them.
As expected, the number of students drop in subsequent attempts, for once students obtained the mark they considered good enough, they did not attempt the quiz anymore. Due to a small number of students participating in higher attempts, the statistics may not be reliable in those attempts. For example, the number of students attempting the quiz more than eight times was below 15 in all years, equivalent to less than 10% of participants. Considering the fact that on average students attempted the quiz four times, the reported statistics are limited to the first four attempts.
Some attempts may have been interrupted, e.g., by Internet disconnection as mentioned in some of the survey comments. These cases are not easy to identify and hence all the collected attempt marks are considered for this analysis.
Table 3 lists the mark statistics in the first four attempts of the quiz from 2012 to 2015. The improvement in the average marks through reattempting the quiz is clear in all years. The biggest improvement is from the first attempt to the second one where the overall average mark was improved by more than 48%.
TABLE 3: Mark statistics in the first four attempts in 2012 to 2015. Marks are reported in percentage.
| Year | Attempts | 1 | 2 | 3 | 4 |
| 2012 | Number of students | 144 | 133 | 101 | 61 |
| Average marks | 38.2 | 62.6 | 70.9 | 78.5 | |
| 2013 | Number of students | 214 | 201 | 160 | 119 |
| Average marks | 47.9 | 68.7 | 74.4 | 80.9 | |
| 2014 | Number of students | 179 | 170 | 144 | 96 |
| Average marks | 50.0 | 69.5 | 73.9 | 78.4 | |
| 2015 | Number of students | 189 | 171 | 142 | 93 |
| Average marks | 41.5 | 63.4 | 69.8 | 73.4 | |
| Overall | Number of students | 726 | 675 | 547 | 369 |
| Average marks | 44.8 | 66.4 | 72.4 | 77.9 |
Figure 2 shows the variation of average marks with attempts considering all the quizzes together. The graph shows a continuous improvement in marks up until five attempts, after which no significant improvement is observed. This suggests that the class is improving during at least the first five attempts. It also suggests that the number of allowed attempts in this quiz was reasonable allowing a plateau to be reached.
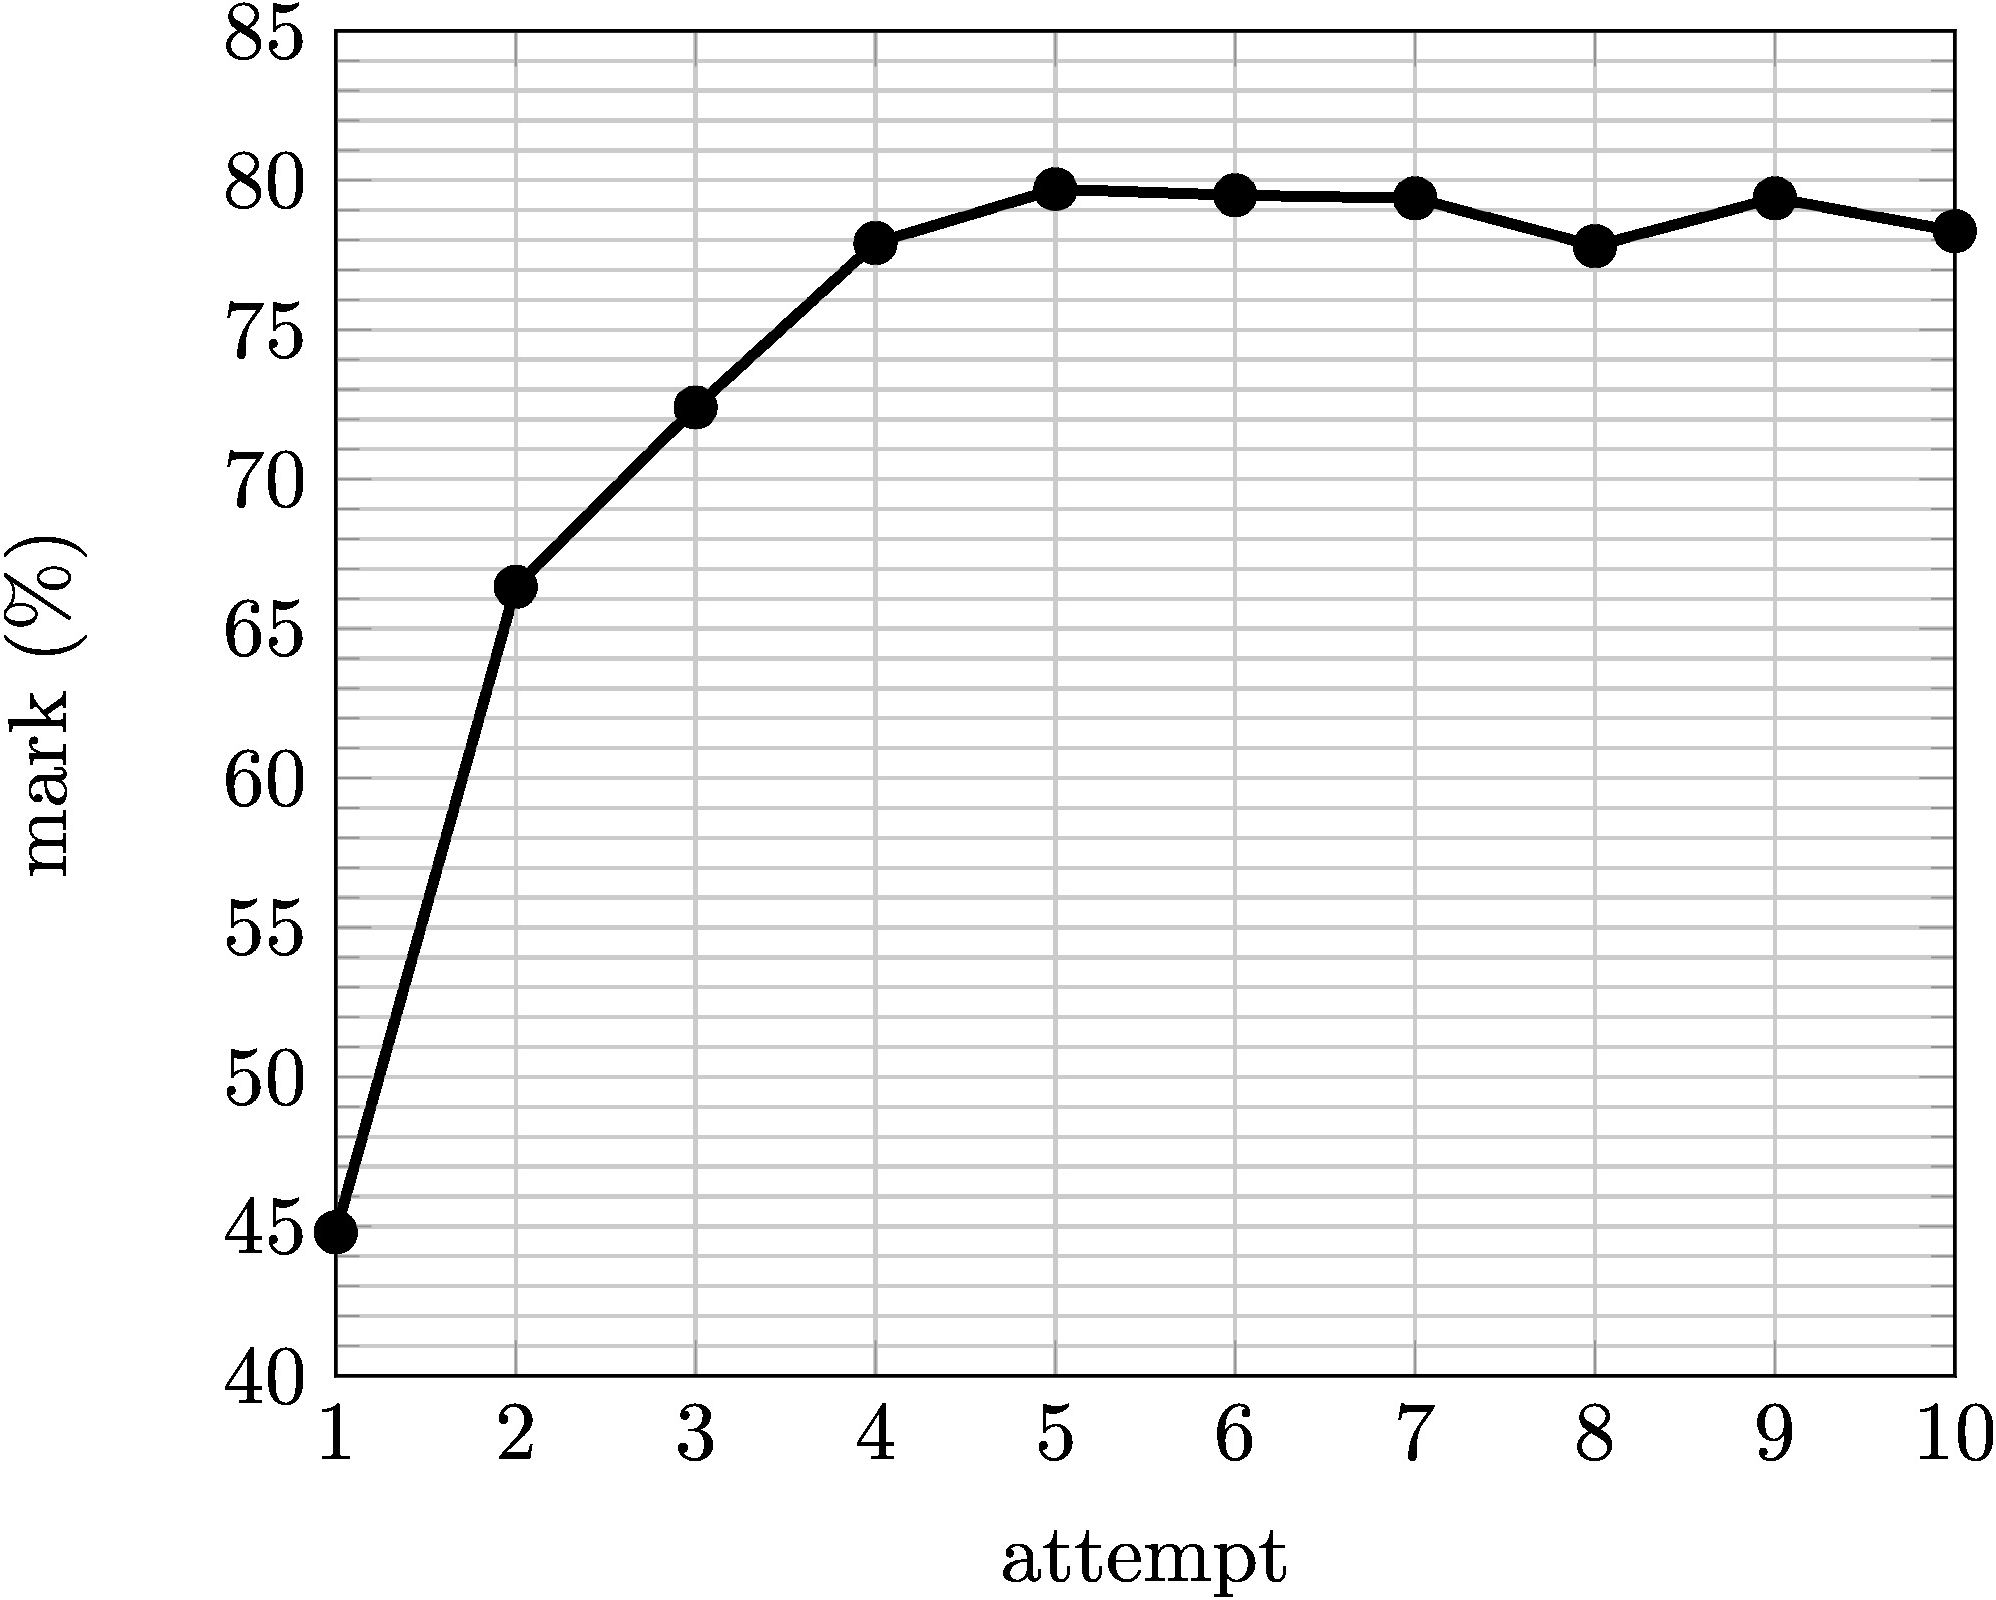
FIG. 2: Improvement of marks through reattempting the quiz
Figure 3 demonstrates the changes in mark distributions over the first four attempts of the quiz in 2012 to 2015. In all four years the gradual shift in the mode of the distribution graph is evident.
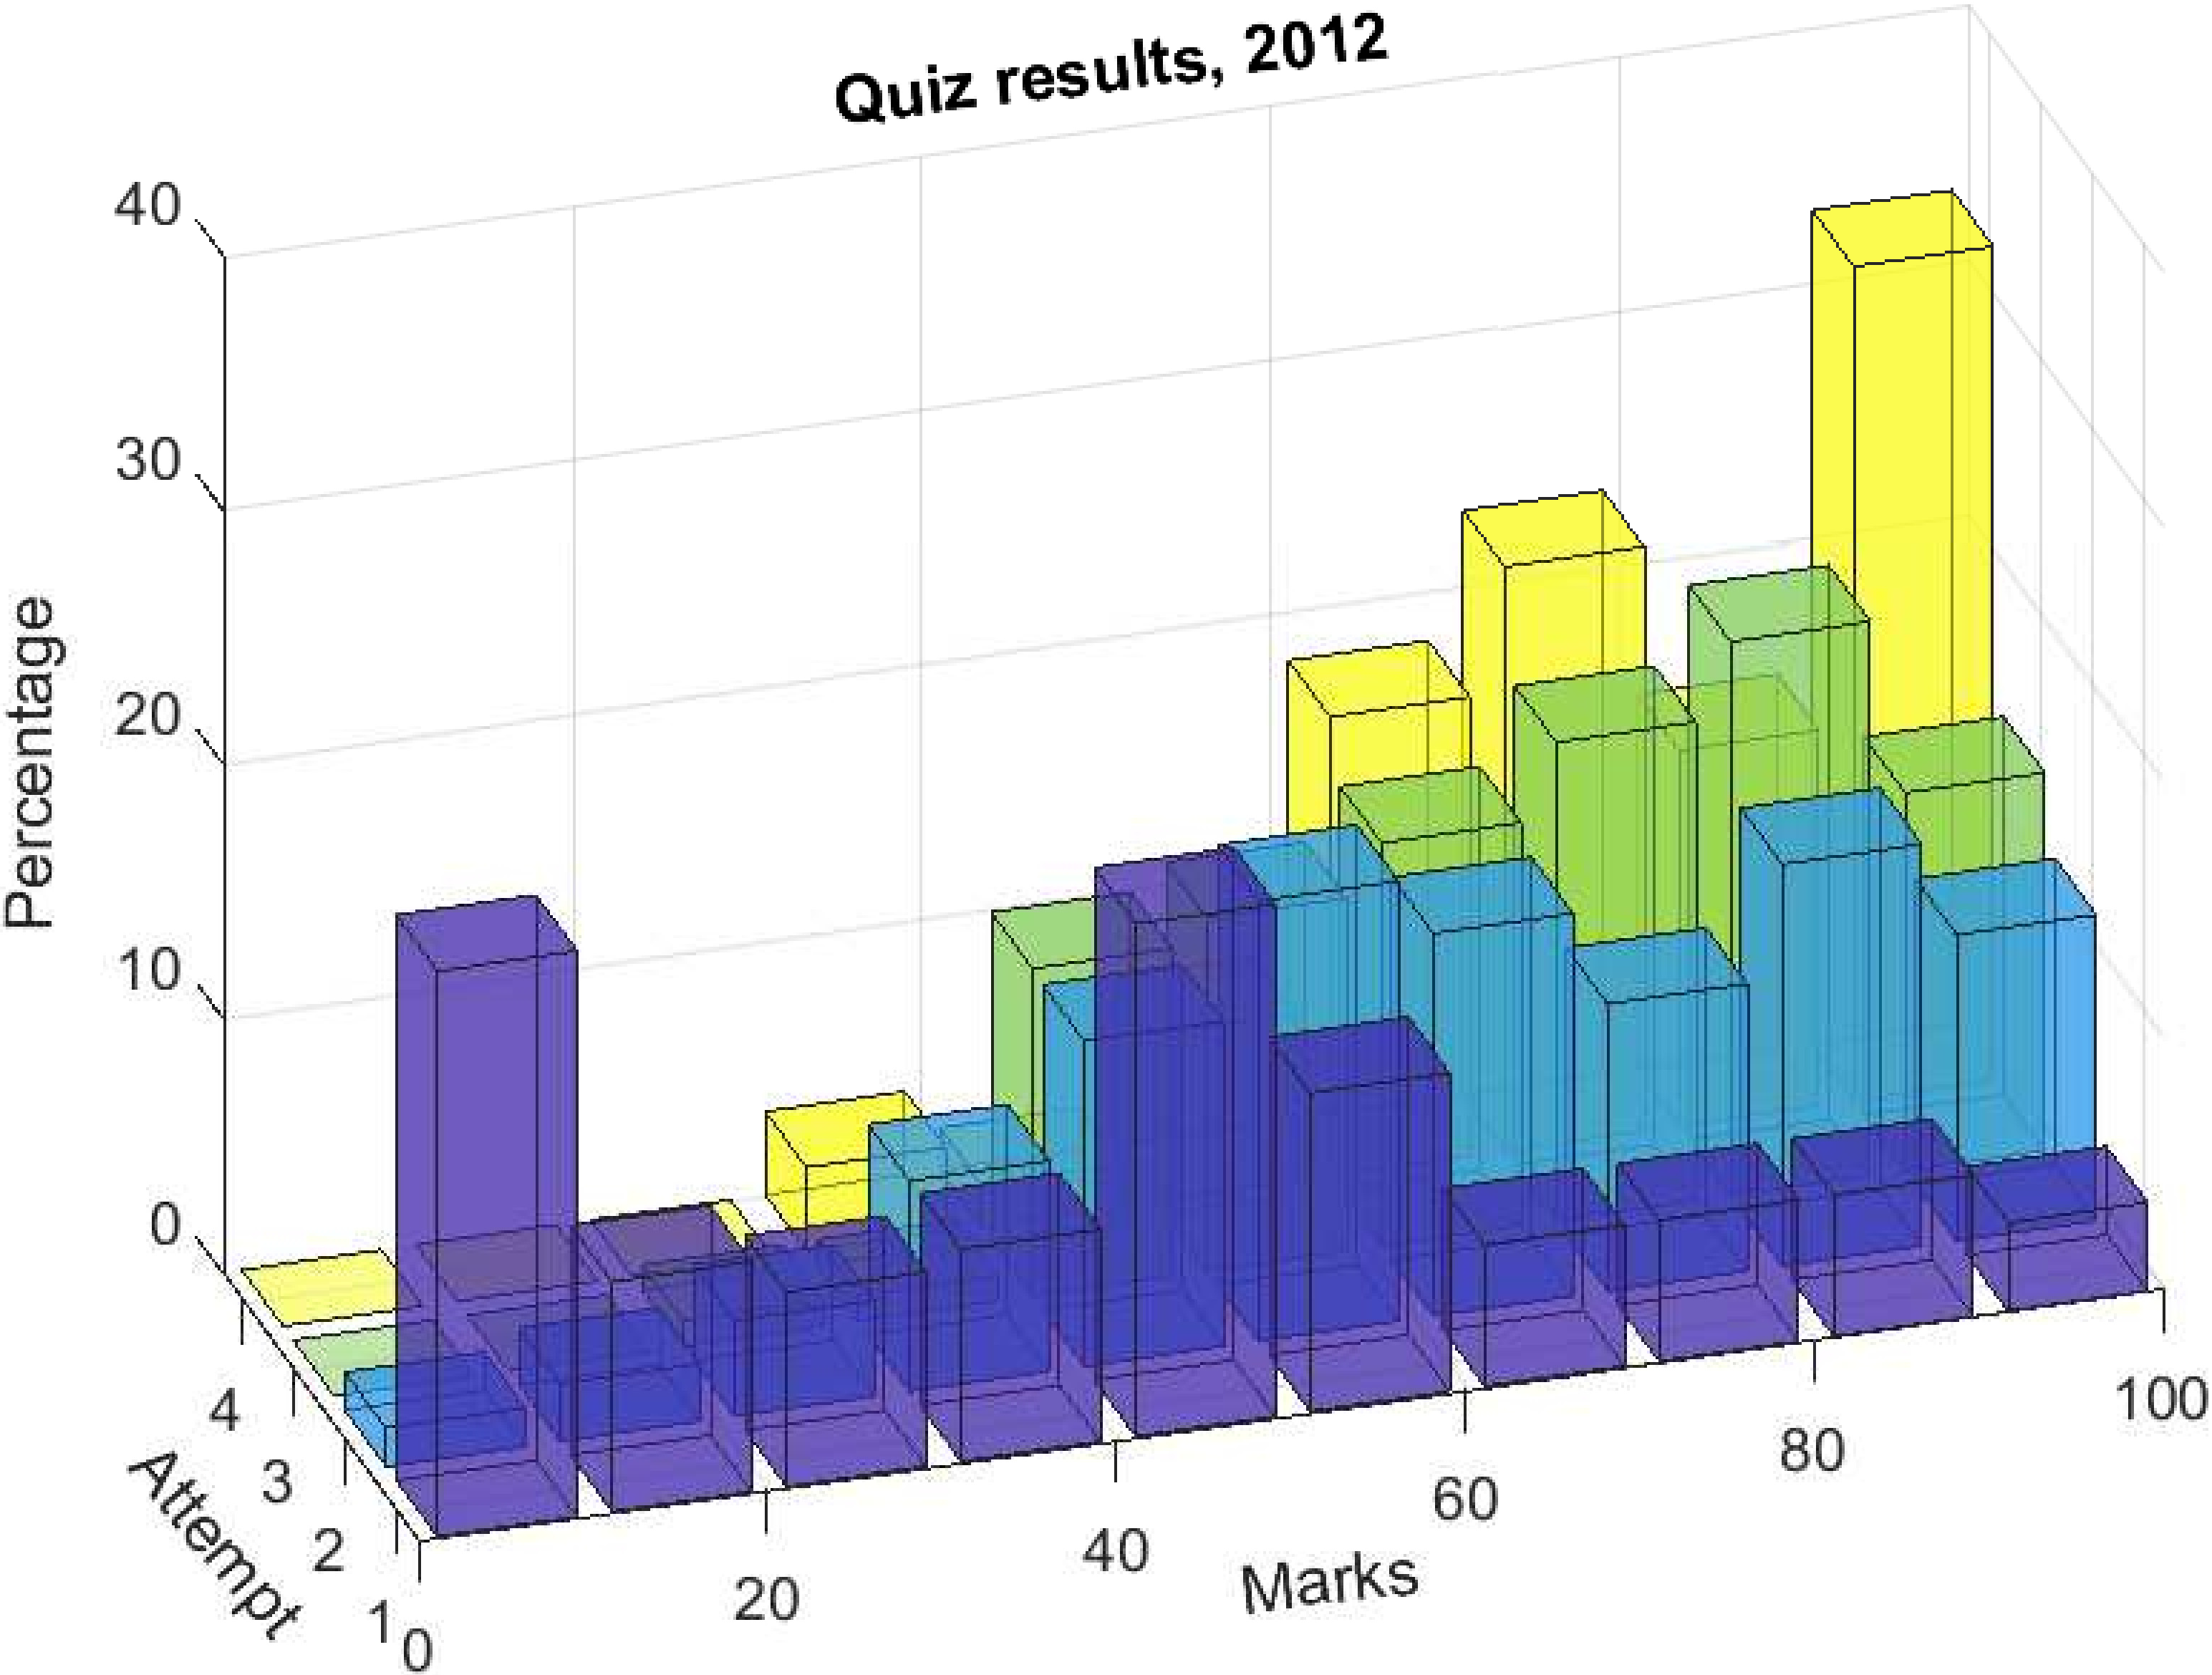
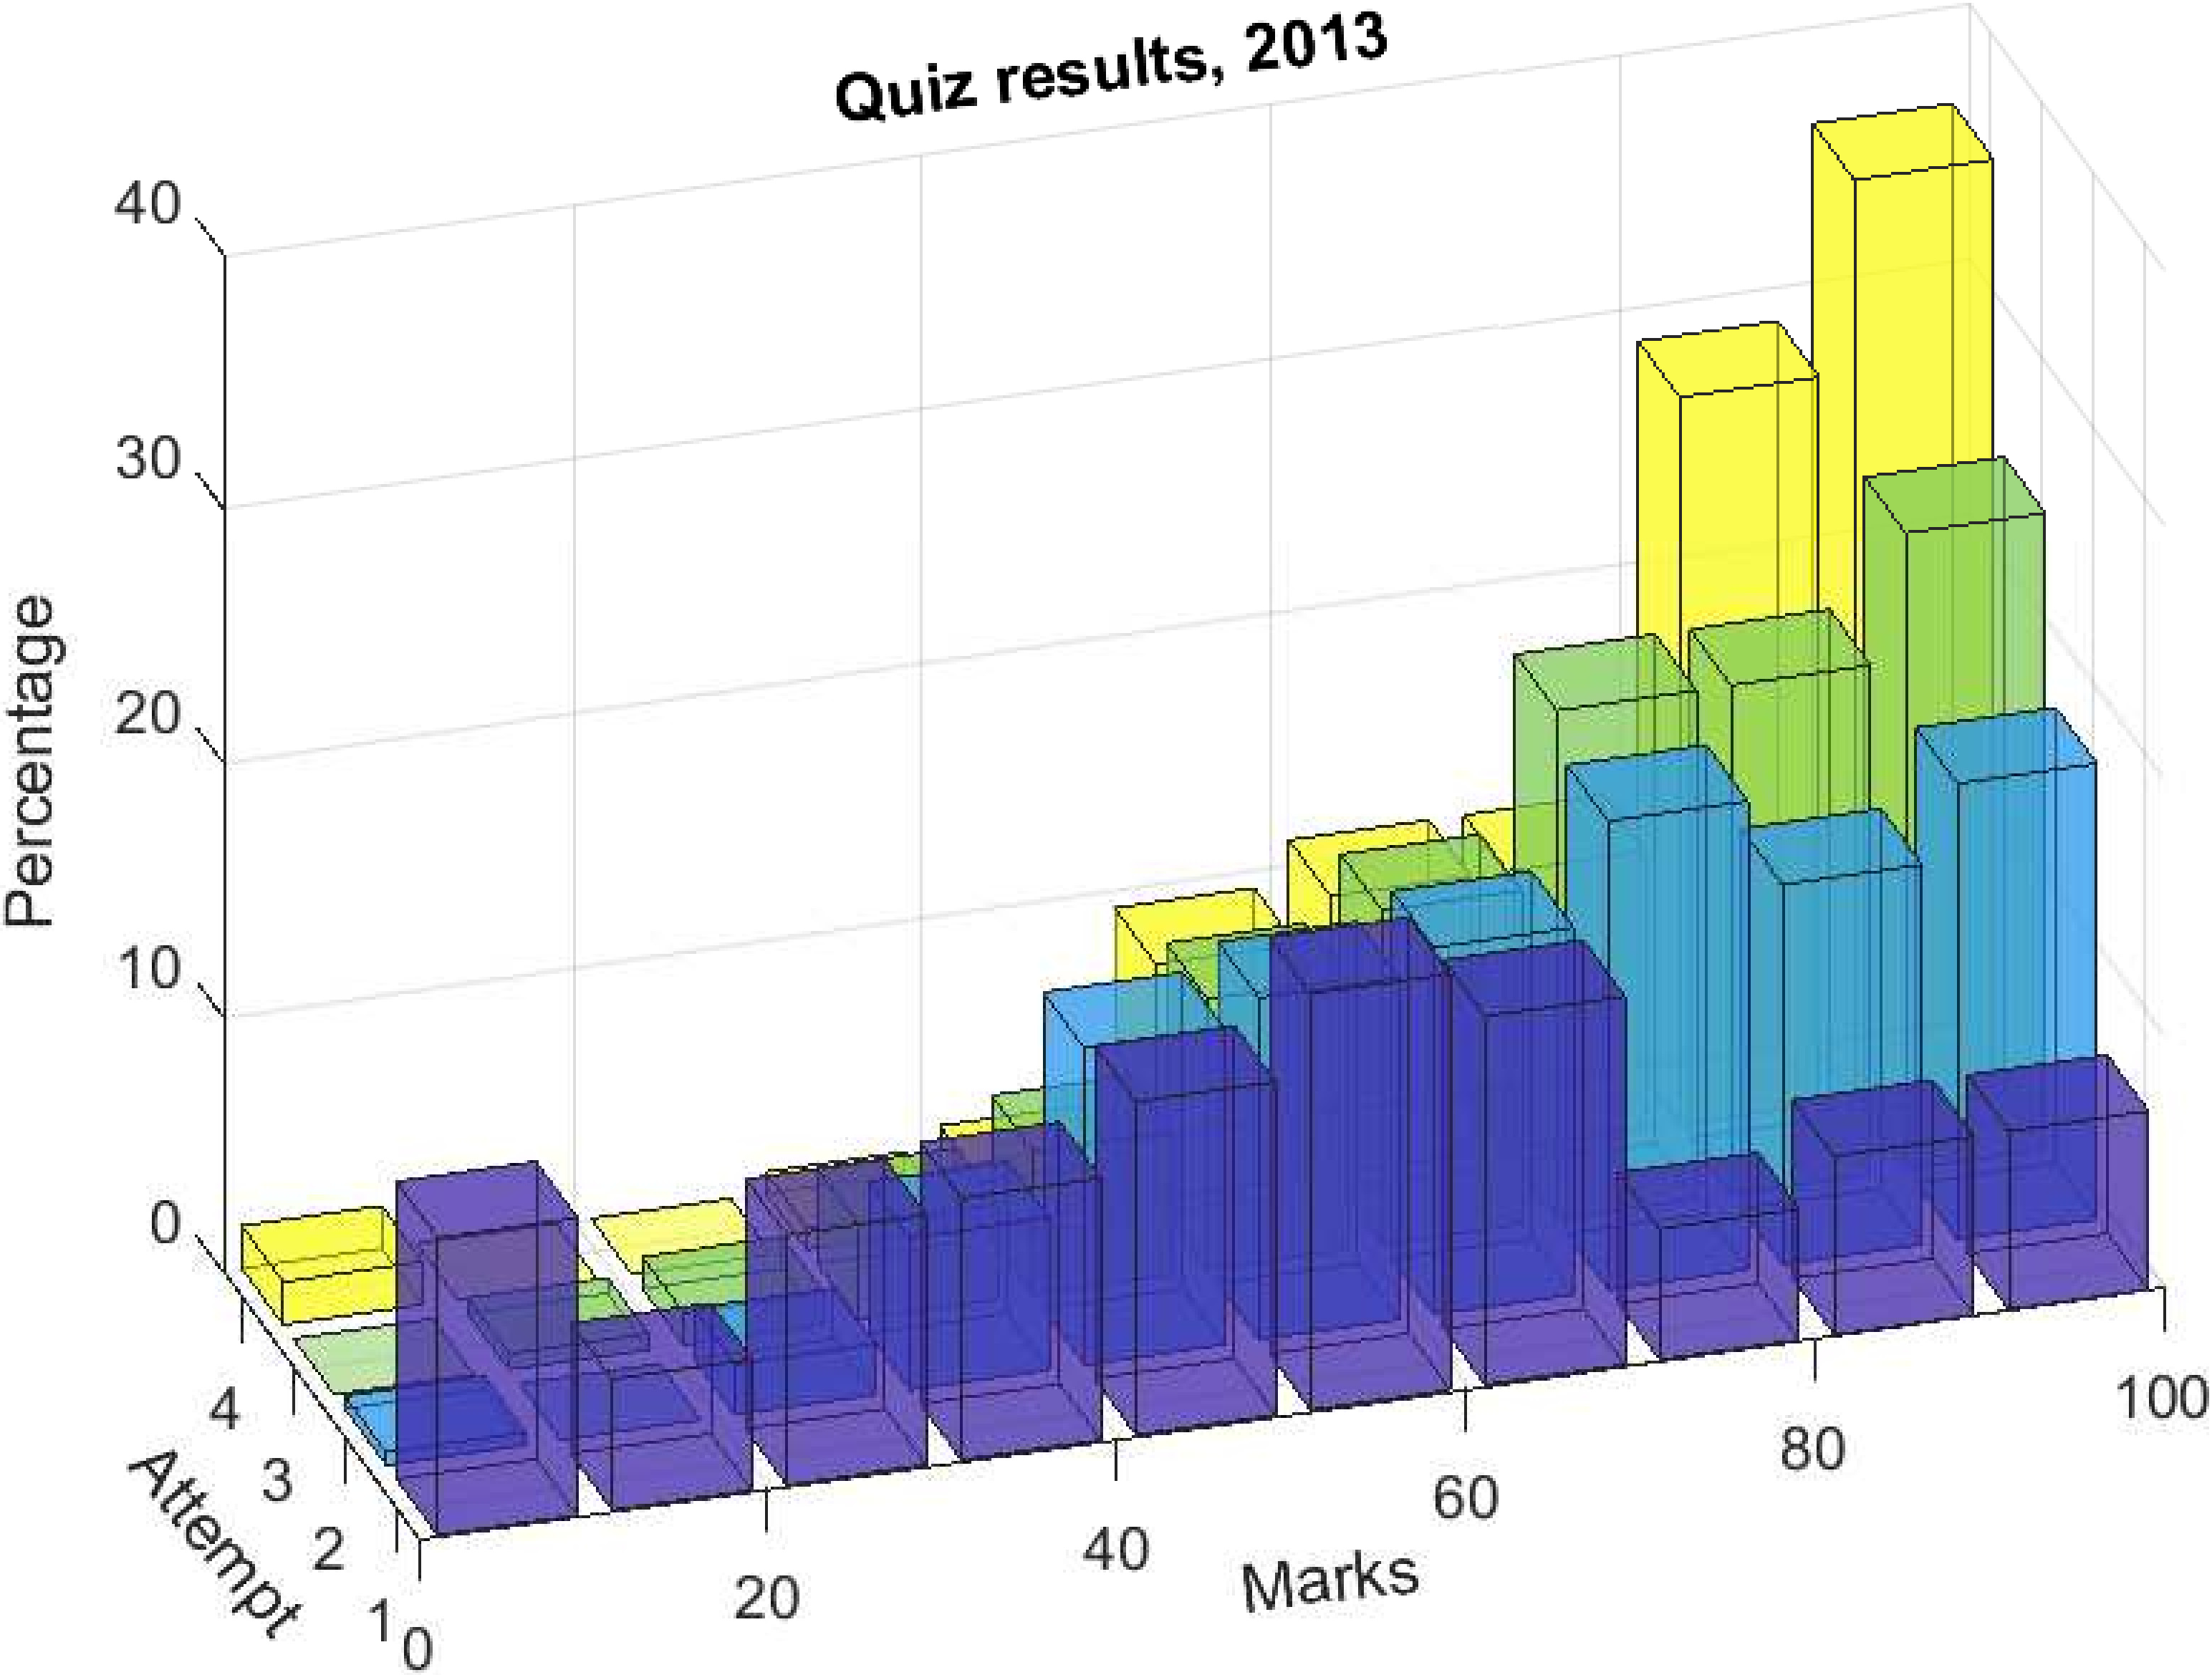
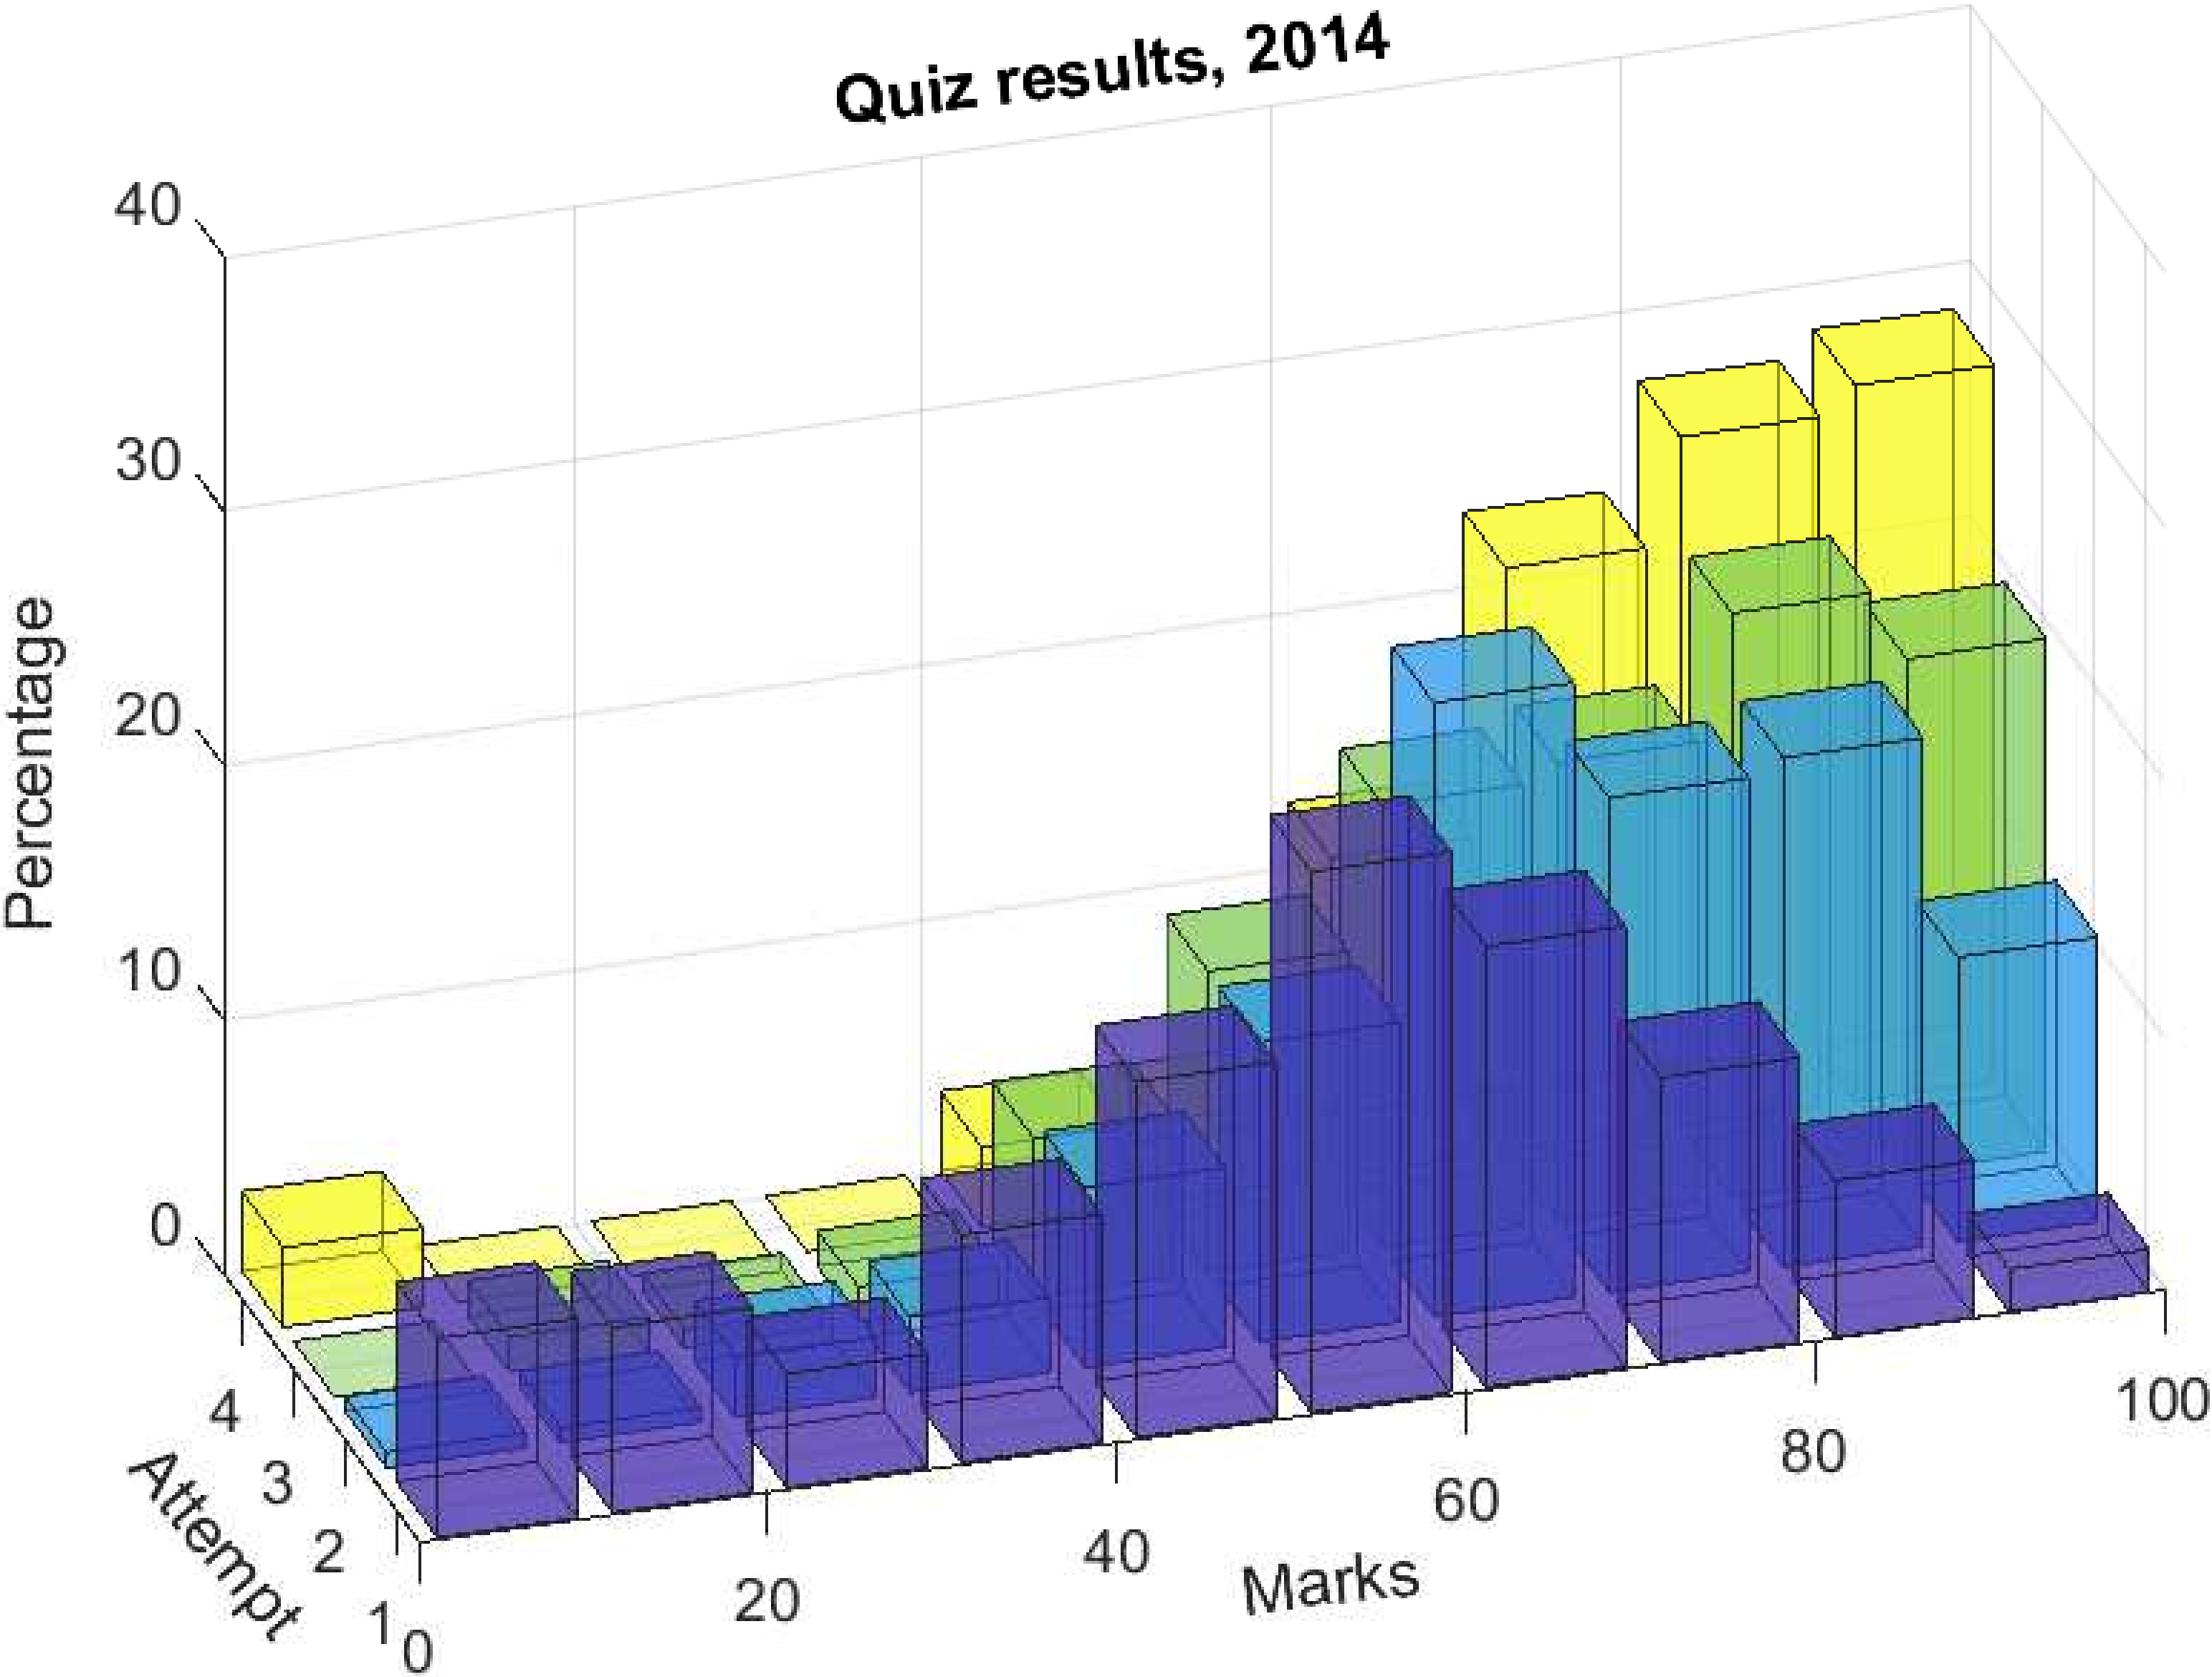
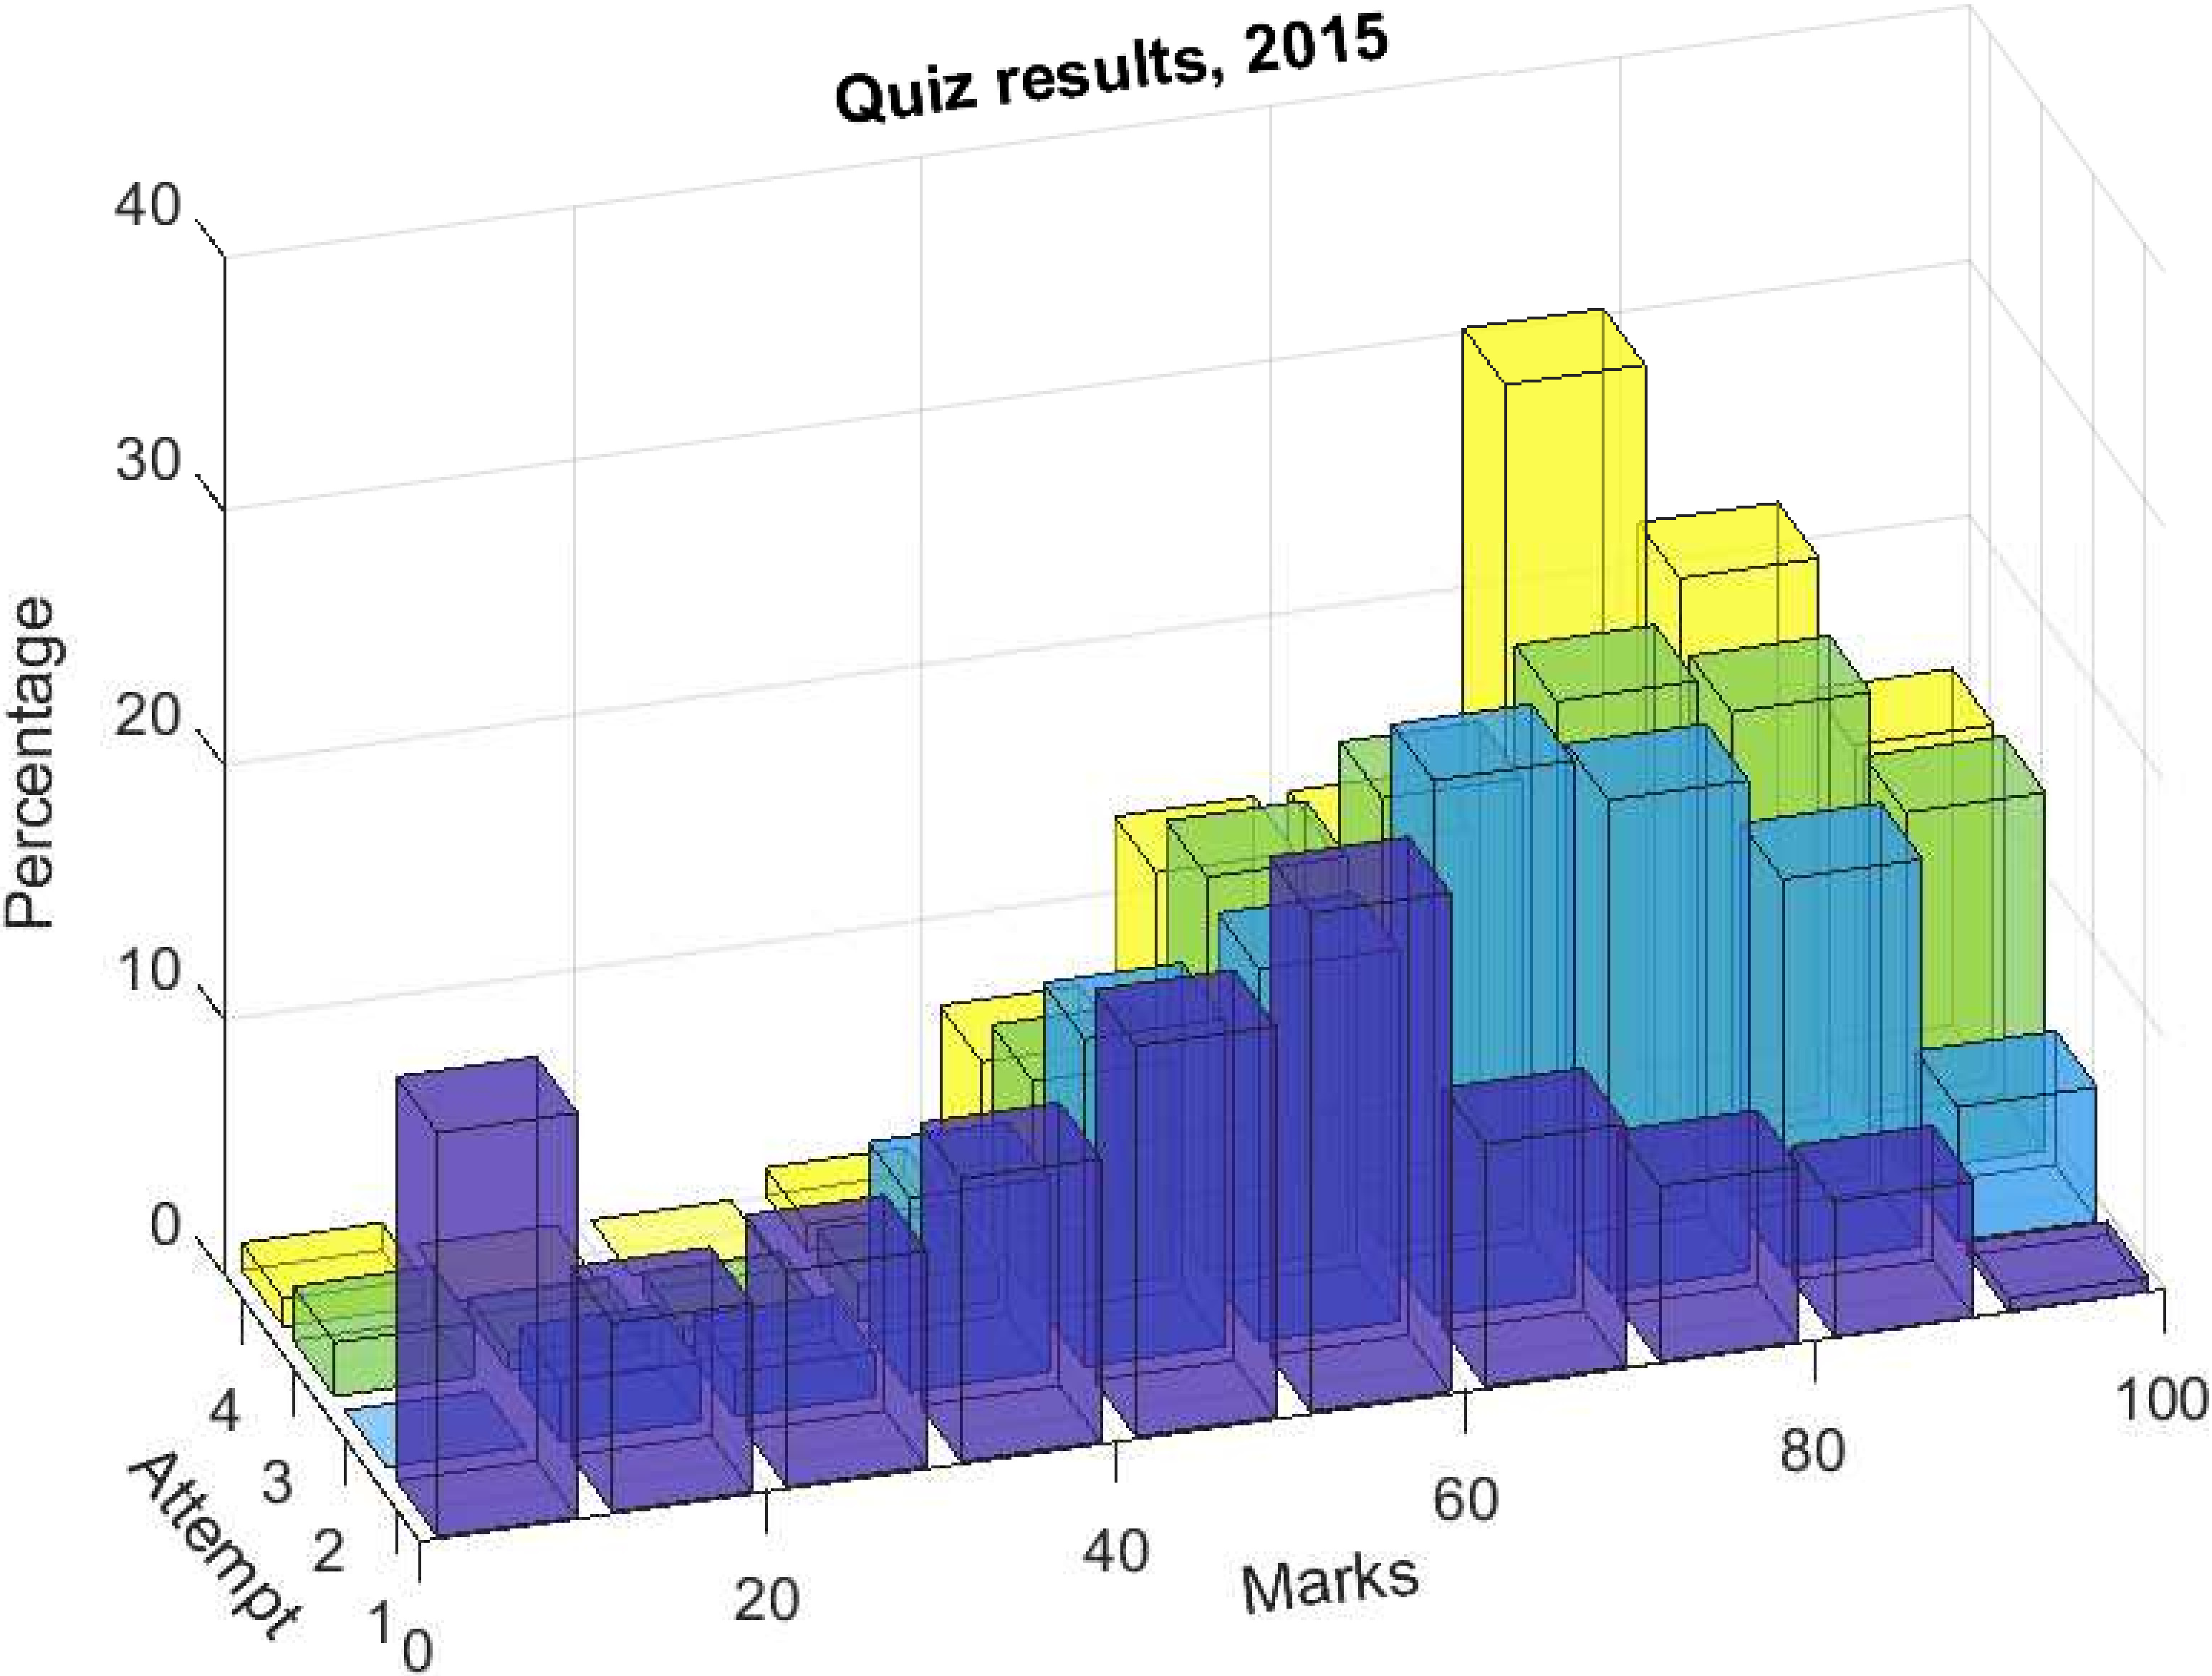
FIG. 3: Mark distributions over the first four attempts in 2012 to 2015
The relatively high number of low marks in first attempts observable in Figure 3 can be mostly attributed to students using their first attempt just to see the questions rather than genuinely trying to solve them knowing that they have more attempts. This behavior was not of concern to the teaching team but it can be prevented easily by setting a minimum required mark in the first attempt before allowing students use their subsequent attempts [see Jordan, (2014)].
4.2 Time Spent on the Quiz
The logs recorded by Moodle were analyzed to see the trends in the time spent in the quiz from 2012 to 2015. As mentioned before, the time limit for each attempt in the quiz was 45 min. until 2013 and then increased to 120 min. from 2014 onwards. The times spent on each attempt are converted to a percentage of the time limit to make them comparable. In few cases, the times recorded were more than the time limit, indicating that students did not submit the quiz on time. This could be due to several reasons including interruptions to Internet connection. These times are capped to the time limit before calculating the average time spent in each attempt in each year. Figure 4 shows these average times for each year.
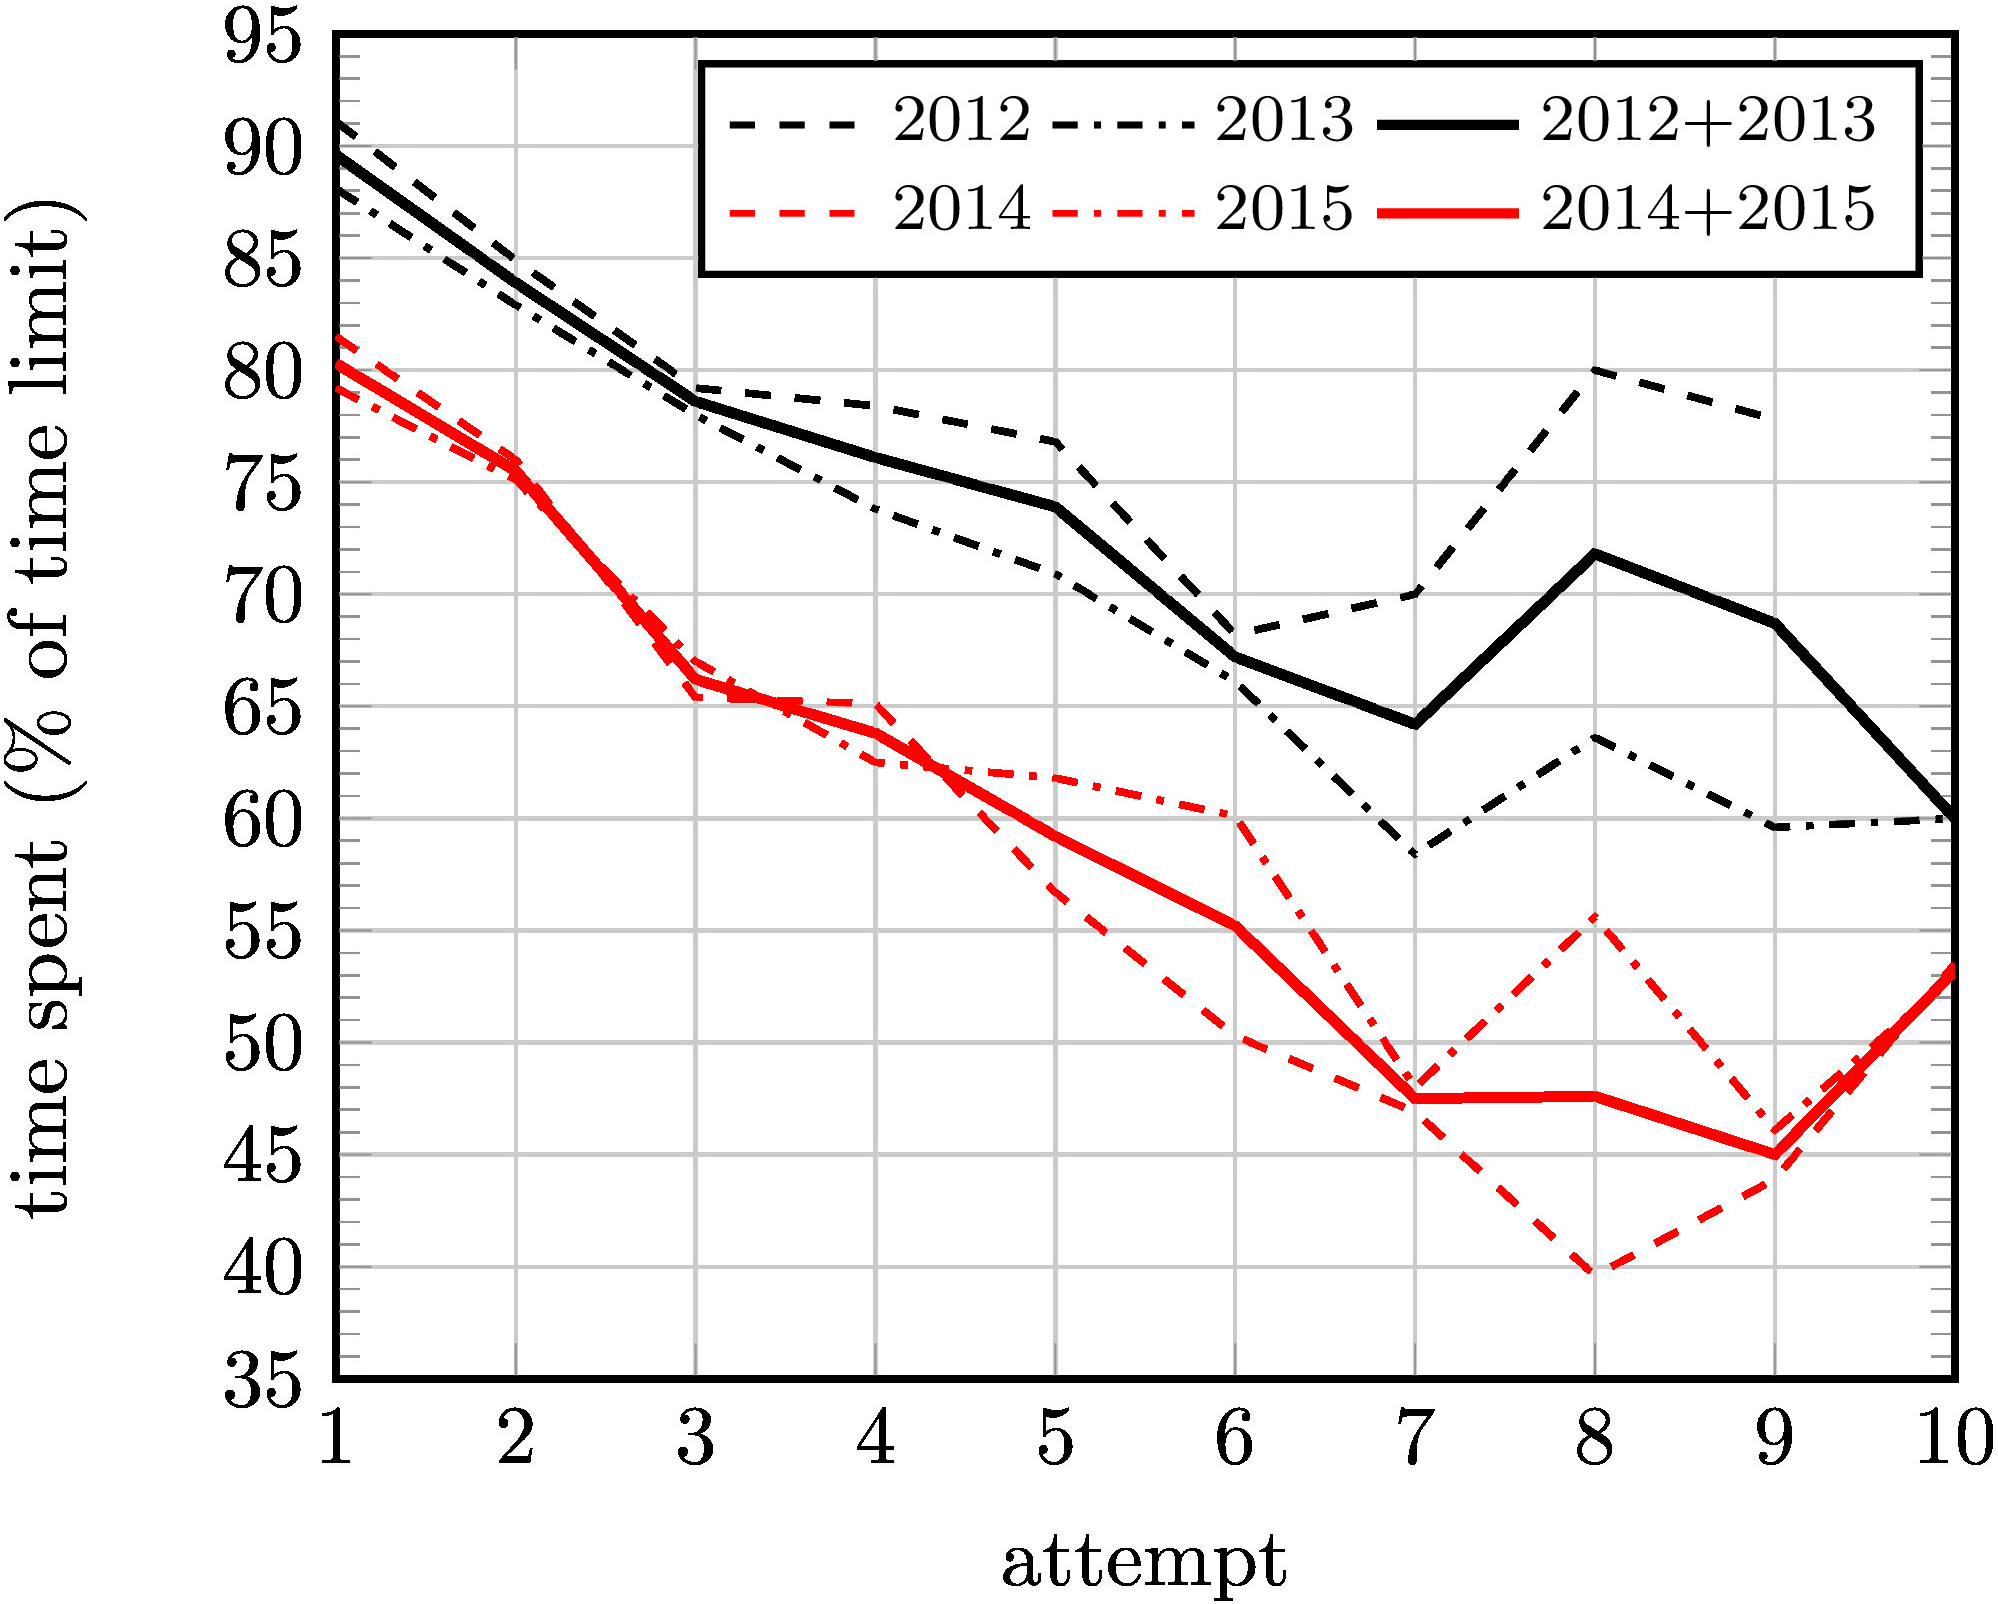
FIG. 4: Average times spent in each attempt in the quiz as a ratio of the time limit
The time graphs for 2012 and 2013 are consistently higher than 2014 and 2015. This suggests that the initial time limit was more restrictive. This observation matches very well with studentsʼ complaints about the time limit up to 2013 which disappeared after increasing the time limit in 2014.
As expected, the time spent on each attempt decreases as students reattempt the quiz. This observation combined with the increase in marks evident in Figure 2 implies that students becoming more skillful in solving the questions, a desirable outcome for the teaching team.
Overall, on average students spent 2.9 times the time limit on their attempts. The actual time spent on this task would be more than this, as this value does not include the study time. This clearly shows an increase in time on task compared to traditional assignments. Moreover, Moodle time logs indicate that most students attempted the quiz over a span of several days.
4.3 Results of Student Surveys
Each year, after the closure of the quiz, students were asked to complete an anonymous online survey about the quiz. These surveys were all conducted through Moodle. The survey was not compulsory. The overall response rate was around 27%.
The survey included 10 to 12 questions looking at different aspects of the quiz plus one open question for students to leave additional comments. Since the second run of the quiz in 2012, students were also invited to write their suggestions on how to improve the quiz.
One of the survey questions was directly relevant to this study. This question asked the students whether the quiz enhanced their learning of the subject on a Likert scale. Summary of responses to this question are listed in Table 4. It is clear that in all years a strong majority of students believed that the quiz enhanced their learning of the subject. Overall, on average just above 90% of respondents agreed or strongly agreed that the quiz had a positive impact on their learning. The weighted average of all responses was 4.35 out of five, sitting between agree and strongly agree.
TABLE 4: Summary of responses to the following question in surveys: Does this quiz enhance your learning of the subject?
| Option Year/Weight | Strongly agree | Agree | Neutral | Disagree | Strongly disagree | Total |
| 5 | 4 | 3 | 2 | 1 | ||
| 2011 | 38 | 25 | 4 | 2 | 0 | 69 |
| 2012 | 18 | 15 | 2 | 0 | 0 | 35 |
| 2013 | 26 | 27 | 4 | 0 | 0 | 57 |
| 2014 | 27 | 26 | 5 | 0 | 2 | 60 |
| 2015 | 16 | 23 | 7 | 0 | 0 | 46 |
| Overall | 125 | 116 | 22 | 2 | 2 | 267 |
| (%) | 46.8 | 43.4 | 8.2 | 0.7 | 0.7 | 100 |
Table 5 summarizes the responses received for another question regarding the best aspect of the quiz. Options 1 and 6 were not available in the 2011 survey. The majority of students (over 60%) thought that the best aspect of the quiz was that it helped them learn the subject (Option 3). This was followed by readiness of the marks and feedback (Option 5, just over 20%) and having multiple attempts in case of an unexpected problem (Option 4, 12.5%).
TABLE 5: Summary of the responses regarding the best aspect of the quiz in surveys. The question and its options are listed below the table.
| Year/Option | 1 | 2 | 3 | 4 | 5 | 6 | Total |
| 2011 | – | 2 | 48 | 2 | 14 | – | 66 |
| 2012 | 1 | 1 | 25 | 2 | 4 | 2 | 35 |
| 2013 | 0 | 3 | 33 | 14 | 7 | 0 | 57 |
| 2014 | 2 | 2 | 30 | 9 | 16 | 1 | 60 |
| 2015 | 0 | 1 | 25 | 6 | 14 | 0 | 46 |
| Overall | 3 | 9 | 161 | 33 | 55 | 3 | 264 |
| (%) | 1.1 | 3.4 | 61.0 | 12.5 | 20.8 | 1.1 | 100 |
1. None, it was terrible.
2. Iʼve got a very good mark, better than what Iʼve expected.
3. The quiz helped me learn the subject.
4. Having several attempts when an unexpected problem occurred during an attempt.
5. My mark/feedback was ready once I submitted my answers.
6. Other
Looking at the results of these two questions, it is clear that from studentsʼ point of view, this quiz was helpful to their learning of the subject material. The majority of students considered this as the best aspect of the quiz. While the former result was expected by the author, the latter was not.
Another question in the survey asked the students about the worst aspect of the quiz. The summary of the responses to this question is listed in Table 6.
TABLE 6: Summary of the responses regarding the worst aspect of the quiz. The question and its options are listed below the table.
| Year/Option | 1 | 2 | 3 | 4 | 5 | 6 | 7 | Total |
| 2011 | – | 3 | 11 | 12 | 0 | – | – | 26 |
| 2012 | 18 | 0 | 1 | 3 | 0 | 5 | 8 | 35 |
| 2013 | 30 | 1 | 4 | 4 | 0 | 12 | 6 | 57 |
| 2014 | 24 | 0 | 5 | 5 | 1 | 14 | 11 | 60 |
| 2015 | 17 | 5 | 2 | 1 | 2 | 13 | 6 | 46 |
| Overall (excluding 2011) | 89 | 6 | 12 | 13 | 3 | 44 | 31 | 198 |
| (%) | 44.9 | 3.0 | 6.1 | 6.6 | 1.5 | 22.2 | 15.7 | 100 |
1. None, it was excellent.
2. Iʼve got an unexpectedly bad mark.
3. I had to type everything and look into the monitor for a long time.
4. Losing some of my answers/attempts due to Internet/computer problem/crash.
5. The questions were not related to the covered material.
6. The feedback I received after each attempt was not really helpful.
7. Other.
Options 1, 7, and notably 6 were not included in 2011 survey and added after reviewing the survey results in 2011. Interestingly, in 2011 survey out of 70 respondents only 26 answered this question, indicating that other options needed to be included in this question. After studying studentsʼ comments in 2011, the other three options were added to this question. After including these additional options, all survey respondents answered this question from 2012 onwards.
Looking at Table 6, it seems that around 45% of students were very happy with the quiz. Around 22% considered the lack of detailed feedback as the main shortcoming of the quiz which is consistent with previous discussions around condition 4 in Gibbs and Simpson (2005).
Students were also asked to rate the difficulty of the questions on a Likert scale. Results are summarized in Table 7.
TABLE 7: Studentsʼ rating of the difficulty of the questions in the quiz
| Option Year/Weight | Extremely hard | Hard | About right | Easy | Too easy | Total |
| 5 | 4 | 3 | 2 | 1 | ||
| 2011 | 0 | 23 | 44 | 1 | 0 | 68 |
| 2012 | 0 | 8 | 23 | 4 | 0 | 35 |
| 2013 | 0 | 6 | 49 | 2 | 0 | 57 |
| 2014 | 3 | 20 | 36 | 1 | 0 | 60 |
| 2015 | 5 | 16 | 25 | 0 | 0 | 46 |
| Overall | 8 | 73 | 177 | 8 | 0 | 266 |
| (%) | 3.0 | 27.4 | 66.5 | 3.0 | 0.0 | 100 |
The weighted average for all the ratings in five years is 3.30, indicating that students overall thought that the difficulty of the questions was reasonable. Not a single student among the 266 responses considered the questions to be too easy. Another interesting observation in Table 7 is that the extremely hard option was only selected after 2014. Table 6 also reveals that option 5 (irrelevance of questions to teaching material) was only selected after 2014. This coincides with introduction of geology questions in 2014. Comments left by students suggest that there is a correlation. Some comments in 2014 and 2015 surveys indicate that the wordings in some geology questions were confusing for students.
4.4 Studentsʼ Comments
The comments that students left could be divided into the following categories:
- Reflecting on their experience
- Suggestions for improvements
- Explaining problems they faced
Most of the reflective comments were about the effect of the quiz on studentsʼ learning. Students identified the multiple attempts as a very useful feature of the quiz. The quiz was described a number of times as an encouraging and engaging study tool and also as a good tool for review, diagnosis, and self-study. The early timing of the quiz was also mentioned a number of times as a positive feature. A couple of comments are listed below as examples:
Absolutely love the multiple attempt feature. It means that i have control over the mark i get and have the opportunity to try harder, revise my material and have another attempt as [opposed] to a one shot attempt that can depend upon environmental factors on the day like work and family stresses…
Yes, just that I thought I was ready for the quiz and I was definitely not according to my first couple of attempts. So, bottom line having ten attempts got me to learn a lot over the past few weeks.
The suggestions were mostly around incorporating more detailed feedback and/or final answers. Increasing time limits was also a repeated comment in the first three years which disappeared after increasing the time limit to 120 min. in 2014. A couple of examples are quoted below:
Not knowing whether my answer to some problems marked as incorrect were due to having insufficient knowledge to answer the question or whether my answers were close to being correct but I had made an input error (i.e., incorrect number of significant figures etc).
If the correct answers were given for every wrong ones, it would be a great help to reflect and try and find out where we went wrong.
This comment was particularly interesting:
Perhaps some guidance on why answers were incorrect. Occasionally I wondered whether the system made a mistake when I really thought I was right. But then again, having to search over the material again was useful in understanding the subject, so Iʼm not too sure.
The most repeated comments in the last group were lack of reliable Internet and disconnections followed by difficulties involved in reading the charts on the screen.
To see all survey responses, including all comments, please refer to Ghabraie (2018).
4.5 Why Some Disapproved the Helpfulness of the Quiz?
The author was curious to see if the four students who disagreed with the positive impact of the quiz on their learning (see Table 4) thought so because of insufficient detailed automatic feedback. Looking at the comments left by these four students, however, reveals that they were not concerned with the feedback: two of these students were not happy with the online/electronic format of the quiz, one of them reported problems with downloading the graphs, and one claimed that the questions were not relevant to the teaching material. Answering to the worst aspect of the quiz (see Table 6), two of these students selected option 4, and the other two selected options 3 and 5. Again, there is no sign that the quality of feedback was of concern.
The author also scrutinized the responses of the 22 students who selected the neutral option in response to the quizʼs impact on their learning (see Table 4). Studying the responses of these students to the worst aspect of the quiz (see Table 6), questionsʼ difficulty level (see Table 7), and their other comments, their reluctance to agree on the positive impact of the quiz on their learning can be attributed to one or more of the following three reasons:
- Questions considered difficult or irrelevant (15 mentions)
- Lack of detailed feedback (6 mentions)
- Issues with technology (6 mentions)
Difficulty of questions seem to be the main contributor in this case. Calculating the weighted average of the responses of these students to the difficulty question (Table 7), the value of 3.91 is obtained, indicating that overall they perceived the questions to be hard.
5. Concluding remarks
This paper investigated the impact of a unique computer-marked online quiz on studentsʼ learning in a second-year civil engineering unit. Multiple attempts were allowed over a certain period of time. The questions in each attempt were randomly selected from available variants in a reasonably sized question bank. Students received minimal feedback, mainly indicating the correctness of their answers to each part of each question. In the end, their best mark among their attempts was recorded as their mark for the quiz.
This particular quiz design was analyzed against the 10 conditions proposed by Gibbs and Simpson (2005). It was concluded that the quiz meets all these conditions at a high level provided that students are allowed and encouraged to seek further detailed feedback from the teaching team during the quiz. This conclusion was supported by studying the improvements in mark distributions over the attempts and also studentsʼ responses to anonymous surveys.
In conclusion, the format of the quiz, the quality of questions, the continuous additional support to those needing more feedback, careful observation through surveys and other means, and improving the assessment based on these observations seem to be the main factors contributing to the success of this particular online CMA.
Based on the reported results, discussions, and observations, the author can list the following suggestions for designing online CMAs in engineering (or more generally in STEM) subjects. The focus of these suggestions is on enhancement of learning, not measuring it.
- CMAs are suitable for mathematical and procedural questions. Based on SOLO taxonomy, CMAs are suitable for assessing skills at unistructural, multistructural, and relational levels but perhaps cannot be easily adopted to extended abstract level [see Biggs and Collis, (1982)].
- The questions should be designed carefully. If the solution process involves a number of steps which can be revealed to students, it is better to include them in the questions. If these steps cannot be revealed, it is advisable to either include more detailed feedback or provide additional feedback manually.
- Attributing a small weight to the assessment task encourages participation. A large weight can put more emphasis on the measuring aspect of the assessment and discourage teaching teams from providing more feedback to students.
- Allowing multiple attempts over a reasonably long period of time and counting the best score proves to be a successful format for CMAs. Apart from motivating students to learn and providing a good review tool, the multiple attempts can be helpful in reducing anxiety levels and negative impacts of unforeseen technology hiccups.
- The teaching team should ideally support students who seek more detailed feedback during the assessment period. This not only helps students but also helps the educators identify the common sources of mistakes based on which they can further improve the automatic feedback in the CMA.
- Seeking feedback from students regarding assessments is of vital importance in identifying their issues and consequently improving them. Similarly monitoring the marks is important. Analyzing the results and time logs can be helpful in selecting the optimal number of attempts, time limits, number of questions, etc.
REFERENCES
Bälter, O., Enström, E., and Klingenberg, B., The Effect of Short Formative Diagnostic Web Quizzes with Minimal Feedback, Comput. Ed., vol. 60, pp. 234–242, 2013.
Becker, H.S., Geer, B., and Hughes, E.C., Making the Grade, New York: John Wiley & Sons, 1968.
Biggs, J. and Tang, C., Teaching for Quality Learning at University: What the Student Does, 4th Edition, New York: McGraw-Hill Education, 2011.
Biggs, J.B. and Collis, K.F., Evaluating the Quality of Learning: The SOLO Taxonomy (Structure of the Observed Learning Outcome), Cambridge, MA: Academic Press, 1982.
Black, P. and Wiliam, D., Assessment and Classroom Learning, Assess. Ed.: Principles, Policy Practice, vol. 5, no. 1, pp. 7–74, 1998.
Burrow, M., Evdorides, H., Hallam, B., and Freer-Hewish, R., Developing Formative Assessments for Postgraduate Students in Engineering, Eur. J. Eng. Ed., vol. 30, no. 2, pp. 255–263, 2005.
Callear, D. and King, T., Using Computer-Based Tests for Information Science, ALT-J., vol. 5, no. 1, pp. 27–32, 1997.
Chickering, A.W. and Gamson, Z.F., Seven Principles for Good Practice in Undergraduate Education, AAHE Bull., vol. 3, p. 7, 1987.
Conole, G. and Warburton, B., A Review of Computer-Assisted Assessment, ALT-J.: Res. Learning Technol., vol. 13, no. 1, pp. 17–31, 2005.
Ghabraie, K., Data on Use of a Computer-Marked On-Line Assessment in Engineering Education over the Course of Five Years, Figshare, accessed June 23, 2018, from https://figshare.com/articles/Data_on_use_of_a_computer-marked_online_assessment_in_engineering_education_over_the_course_of_five_years/6662432/1, 2018. Gibbs, G. and Simpson, C., Conditions under Which Assessment Supports Studentsʼ Learning, Learning Teaching Higher Ed., vol. 1, pp. 3–31, 2005.
Hughes, G., Towards a Personal Best: A Case for Introducing Ipsative Assessment in Higher Education, Studies Higher Ed., vol. 36, no. 3, pp. 353–367, 2011.
Jordan, S., Jordan, H., and Jordan, R., Same but Different, but Is It Fair? An Analysis of the Use of Variants of Interactive Computer-Marked Questions, Proc. of the 14th Int. Computer Assisted Assessment (CAA) Conf., Southampton, July 5–6, 2011.
Jordan, S.E., E-Assessment for Learning? Exploring the Potential of Computer-Marked Assessment and Computer-Generated Feedback, from Short-Answer Questions to Assessment Analytics, PhD, The Open University, 2014.
Kirkwood, A. and Price, L., Learners and Learning in the Twenty-First Century: What Do We Know about Studentsʼ Attitudes Towards and Experiences of Information and Communication Technologies that Will Help Us Design Courses?, Studies Higher Ed., vol. 30, no. 3, pp. 257–274, 2005.
Miller, C.M. and Parlett, M., Up to the Mark: A Study of the Examination Game, London: Society for Research into Higher Education, 1974.
Nicol, D.J. and Macfarlane-Dick, D., Formative Assessment and Self-Regulated Learning: A Model and Seven Principles of Good Feedback Practice, Studies Higher Ed., vol. 31, no. 2, pp. 199–218, 2006.
Roediger III, H.L. and Karpicke, J.D., The Power of Testing Memory: Basic Research and Implications for Educational Practice, Perspectives Psychol. Sci., vol. 1, no. 3, pp. 181–210, 2006.
Sim, G., Holifield, P., and Brown, M., Implementation of Computer Assisted Assessment: Lessons from the Literature, ALT-J., vol. 12, no. 3, pp. 215–229, 2004.
Snyder, B.R., The Hidden Curriculum, New York: Knopf, 1971.
Thelwall, M., Computer-Based Assessment: A Versatile Educational Tool, Comput. Ed., vol. 34, no. 1, pp. 37–49, 2000.
Wiliam, D. and Black, P., Meanings and Consequences: A Basis for Distinguishing Formative and Summative Functions of Assessment?, Brit. Ed. Res. J., vol. 22, no. 5, pp. 537–548, 1996.
NOTES:
† https://moodle.com/, accessed on June 14, 2018.↩
‡ 3.94 to be more accurate. Total number of registered attempts from 2012 to 2015 is 2858. Total number of participants in these years is 726.
Comments
Show All Comments